
Fig. 3 .
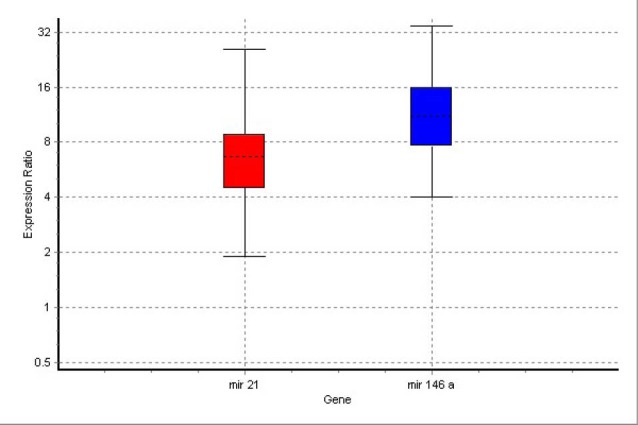
Boxes represent the interquartile range, or the middle 50% of observations. The dotted line represents the median gene expression. Whiskers represent the minimum and maximum observations.
Official websites use .gov
A
.gov website belongs to an official
government organization in the United States.
Secure .gov websites use HTTPS
A lock (
) or https:// means you've safely
connected to the .gov website. Share sensitive
information only on official, secure websites.
Boxes represent the interquartile range, or the middle 50% of observations. The dotted line represents the median gene expression. Whiskers represent the minimum and maximum observations.