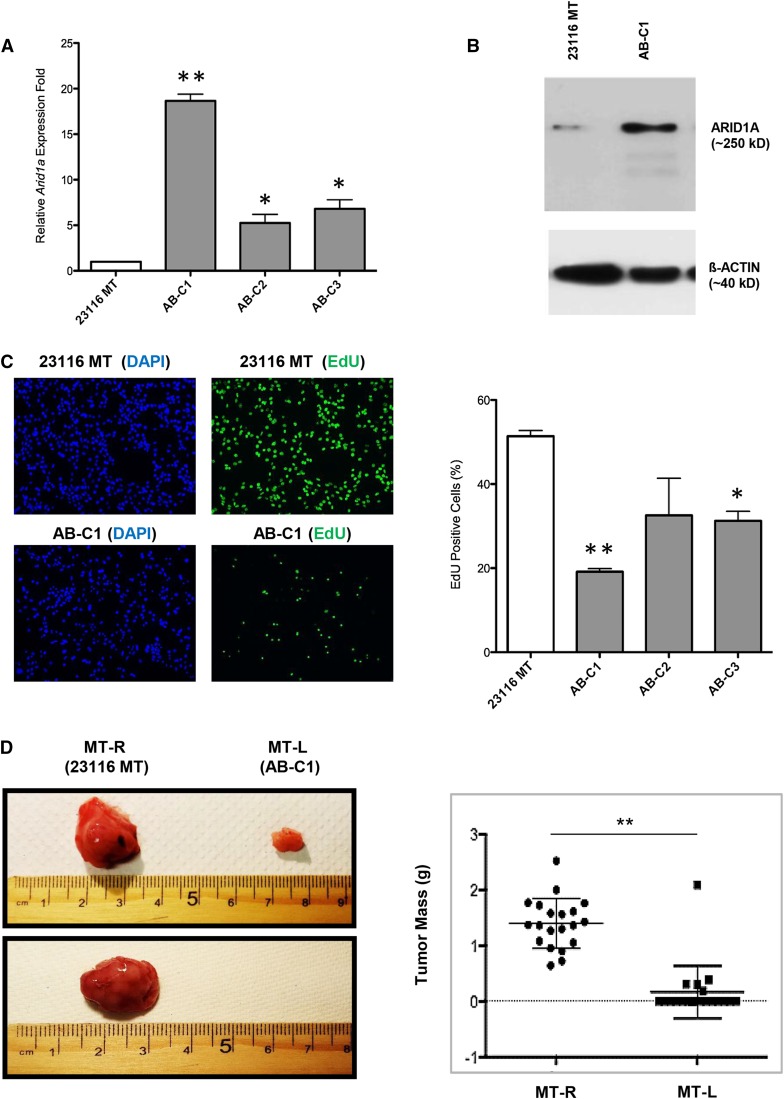
Figure 3.
Overexpression of Arid1a in C3H-Chaos3 MT cell line reduces proliferation rate and prevents tumor growth. (A) Arid1a expression levels quantified by qRT-PCR in untransduced Chaos3 MT cell line (23116 MT) and three individual clonal lines (AB-C1, A-C2, and AB-C3) transduced with the Arid1a expression vector. Results are shown as the mean ± SEM of three technical replicates. Significant differences were calculated using a two-tailed Student’s t-test (* P < 0.05; ** P < 0.001). Values are relative to untransduced parental cell line 23116 MT. (B) Arid1a expression levels quantified by immunoblotting in indicated cell lines. (C) EdU incorporation assays of 23116 MT vs. AB clones (C1–C3). Error bars signify the mean ± SEM of three experimental replicates, with >1000 cells counted per sample for each replicate. Significant differences were calculated using a two-tailed Student’s t-test (* P < 0.05; ** P < 0.001). Values are relative to untransduced parental cell line 23116 MT. (D) Representative images of tumors (or lack thereof) arising from transplantation of 23116 MT (MT-R) and AB-C1 (MT-L) cells into cleared fad pads of recipient syngeneic C3H females. MT-R and MT-L refer to right and left sides of mouse, respectively (see Materials and Methods). Next to it is a plot depicting individual weights of tumors (n = 20 mice, 40 potential tumors). Significant differences between the control and experimental groups were calculated using a two-tailed Student’s t-test (** P < 0.001).

