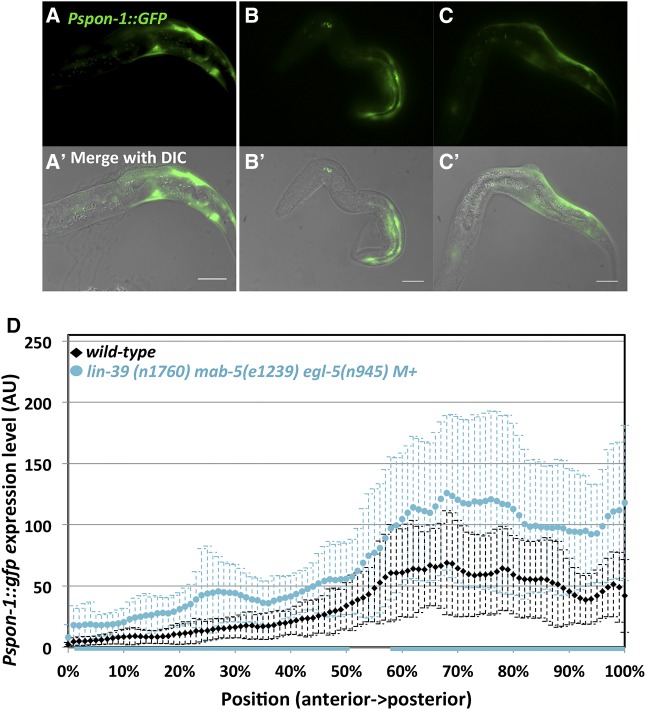
Figure 11.
Pspon-1::gfp in lin-39 mab-5 egl-5 triple mutant. Fluorescent micrographs (A–C) and merged DIC micrographs (A′, B′, and C′) of three lin-39(n1760) mab-5(e1239) egl-5(n945) M+ animals with Pspon-1::gfp. Animals are 4–4.5 hr posthatching. Bar, 10 μM. Anterior is to the left, and dorsal is up. (D) Graphs representing intensity of Pspon-1:gfp expression in lin-39 mab-5 egl-5 M+ as in Figure 8.

