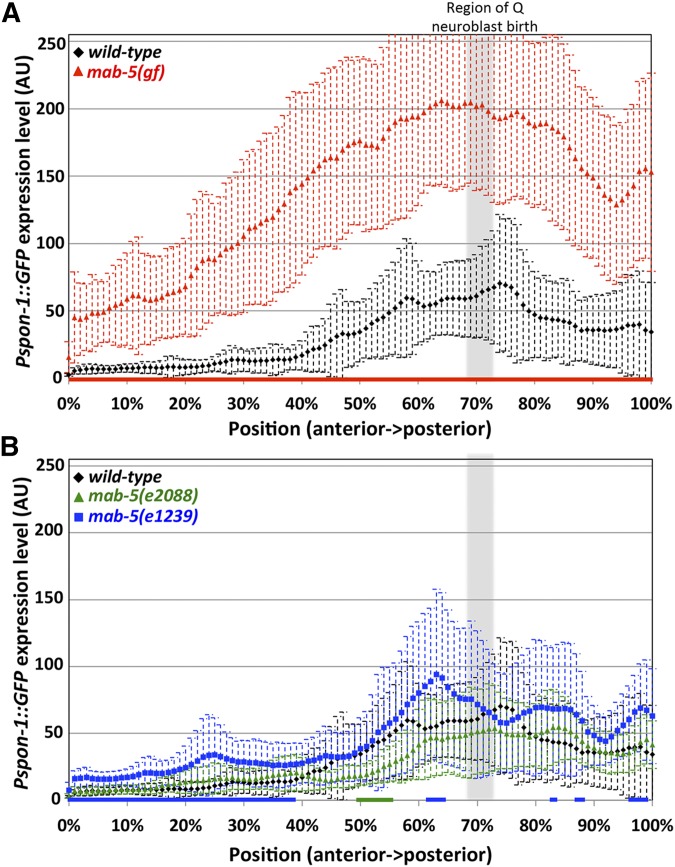
Figure 8.
Quantification of Pspon-1::gfp intensity in BWMs. Graphs represent intensities of Pspon-1::gfp expression determined by line scans through BWM quadrants in L1 animals 4–4.5 hr posthatching (see Materials and Methods). The y-axis represents the intensity of GFP in arbitrary units (AU). The x-axis corresponds to position on the animal (0% is the posterior pharyngeal bulb, 100% is at the anus). The approximate region of Q neuroblast birth is shaded gray. Dashed error bars represent one standard deviation. Colored bars along the x-axis correspond to regions of significant difference compared to wild-type (Q < 0.05, multiple comparison corrected Student’s t-test, n = 40 BWM quadrants) (two per animal, dorsal and ventral combined). (A) mab-5(e1751) gain of function. (B) mab-5 putative null mutants e2088 and e1239.

