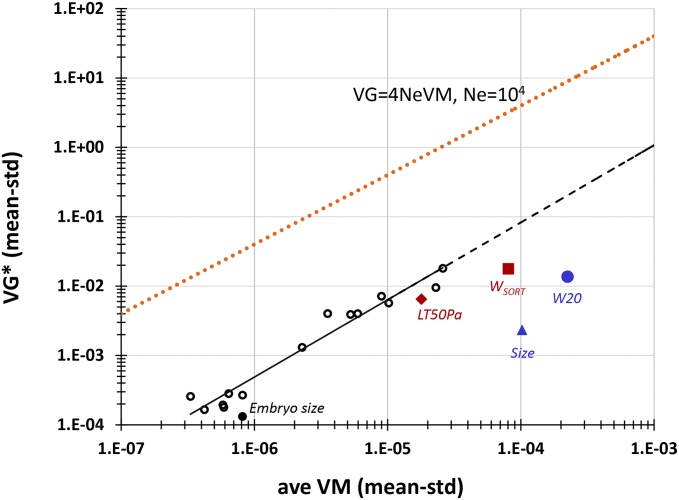
Figure 3.
Mean-standardized VG* plotted against mean-standardized VM. The solid black line shows the best fit of the spindle trait data; the dashed black line represents the extension of the best-fit line. The orange dotted line shows 4NeVM for Ne = 104. See text for description of labeled traits and experimental details. Traits labeled in red were measured on the same set of wild isolates included in this study.

