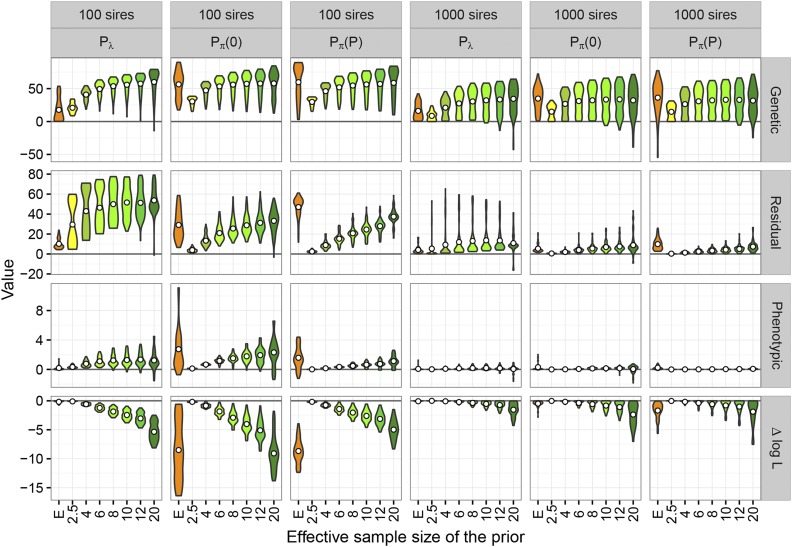
Figure 2.
Distribution of percentage reduction in average loss for estimates of genetic, residual, and phenotypic covariance matrices, together with corresponding change in log-likelihood () for penalties on canonical eigenvalues () and genetic, partial autocorrelations, shrinking toward zero [] or phenotypic values []. Centered circles give mean values. Numerical values on the x-axis are fixed, prior effective sample sizes while “E” denotes the use of a value estimated from the data for each replicate.

