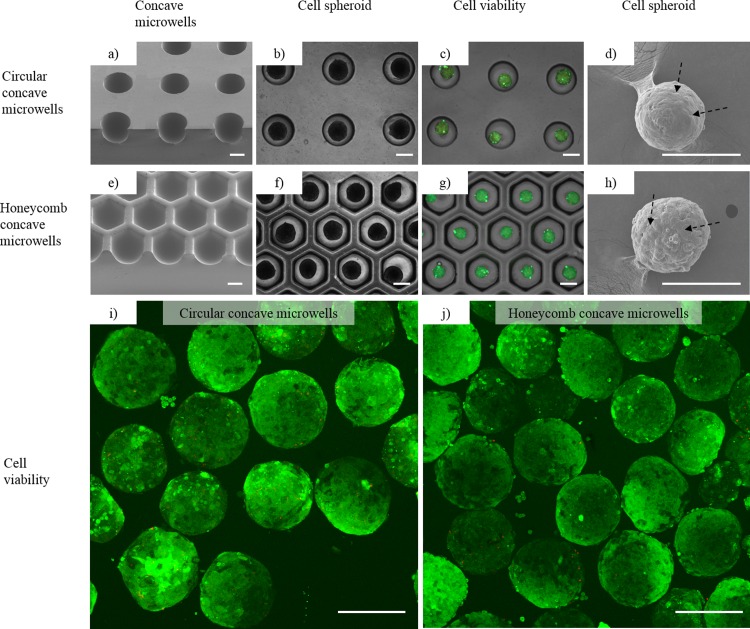
Fig 5. Hepatocytes cultured in (1) circular concave microwells and (2) honeycomb concave microwells.
(a, e) Scanning electron microscopy (SEM) images showing the smooth bottom profile of concave microwells 1 and 2. (b, f) Images of hepatocyte spheroids formed in concave microwells 1 and 2. (c, g) Merged images of Calcein AM- and Ethidium homodimer-1-stained spheroids. Calcein AM-stained hepatocyte spheroids (green) cultured for 3 days showing cell viability in concave microwells 1 and 2. Ethidium homodimer-1 fluorescence images (red), which indicate dead cells, are weakly appeared on the images. Scale bars: 500 μm. (d, h) SEM images of spheroids showing formation of tight cell-to-cell junctions in spheroids (black arrows) formed in concave microwells 1 and 2. Confocal microscopic images of cell viability in circular concave microwells (i) and honeycomb concave microwells (j). Scale bars: 250 μm.

