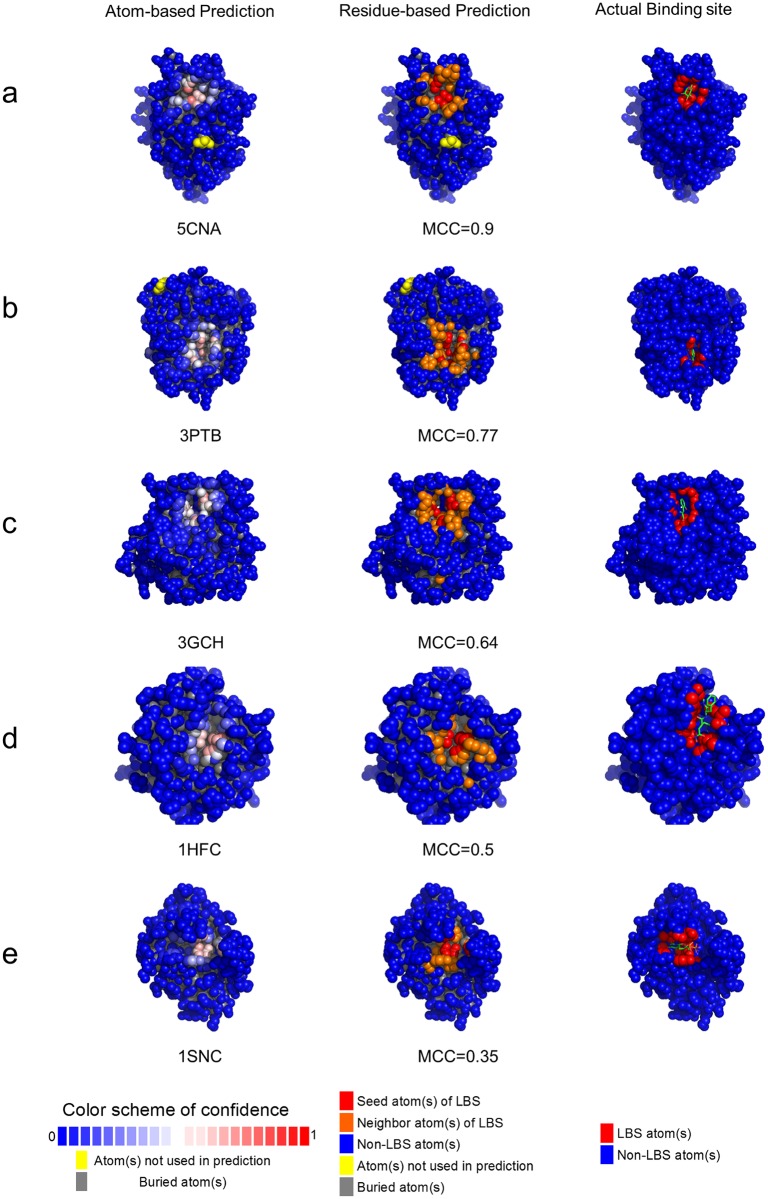
Fig 3. Examples of ligand binding site predictions in S48b testing set.
Panels (a) to (e) show the prediction examples of five proteins from S48b testing set with MCC of 0.9, 0.77, 0.64, 0.5 and 0.35, respectively. The left-hand side structures are color-coded by atom-based prediction confidence level. The color bar at the bottom of this column shows the color scheme for normalized prediction confidence level. The seed atoms are colored in red of various level of depth. The protein structures of the middle column show the residue-based ligand binding site predictions. The residues colored in red or orange represent the positive residues of the predicted patches in the ligand binding sites. The red atoms were predicted with prediction confidence level greater than 0.5; other atoms in the positive residues of predicted patches with prediction confidence level less than 0.5 are colored in orange. The right-hand side structures show the surface atoms in close contact with the ligands. The atom colored in red are within 4.5 Å distance to any heavy atom of corresponding ligand. The PDB code name and the MCC for each of the examples are also shown. The complete prediction benchmarks for all testing sets are available for interactive examination from the ISMBLab web server: http://ismblab.genomics.sinica.edu.tw/>benchmark>Protein-Ligand.

