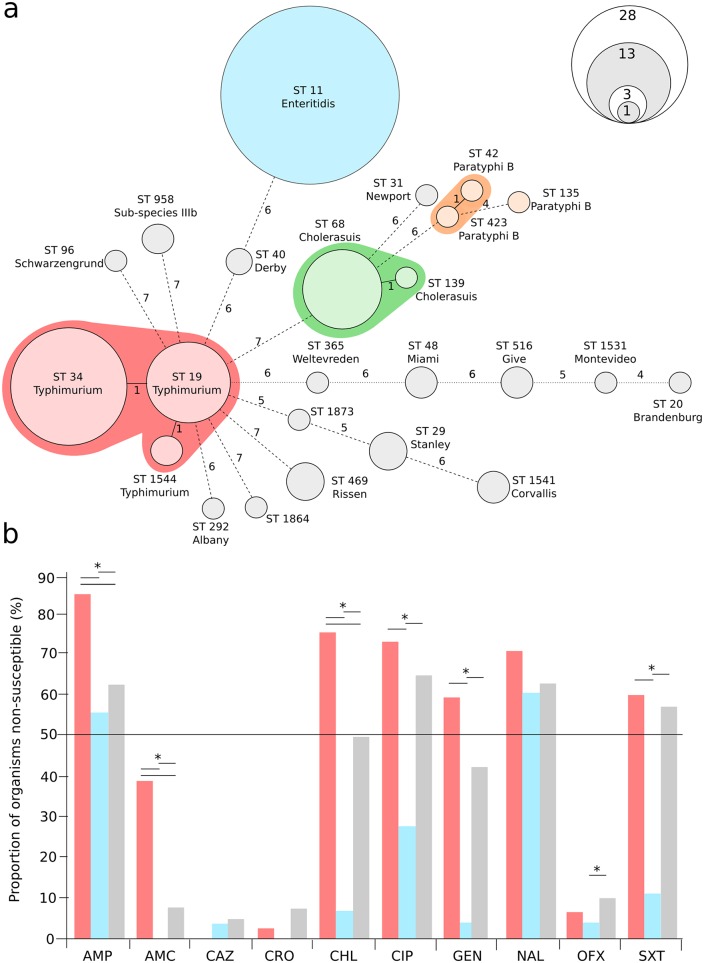
Fig 1. Identified Salmonella sequence types and serovars causing invasive disease and their antimicrobial susceptibility profiles.
a) Minimum spanning tree of 142 iNTS isolates created using seven allele MLST profiling. The sequence type (ST) of each allele profile is shown along with the inferred serovar. Clonal complexes (S. Typhimurium, S. Enteritidis, S. Cholerasuis and S. Paratyphi B [tartrate positive]) are highlighted. The size of each ST group corresponds with the number of isolates with the same ST profile (scale shown), and the branches are labeled by the number of variable alleles between STs. b) Bar graph showing the proportion of organisms (red, S. Typhimurium; blue, S. Enteritidis and grey, others) exhibiting resistance against ampicillin (AMP), amoxicillin/clavulanate (AMC), ceftazidime (CAZ), ceftriaxone (CRO), chloramphenicol (CHL), ciprofloxacin (CIP), gentamicin (GEN), nalidixic acid (NAL), ofloxacin (OFX) and trimethoprim-sulfamethoxazole (SXT). Asterisks signify statistically significant differences in the proportion of organisms exhibiting resistance to the individual antimicrobial (p<0.05, Fisher’s exact test).

