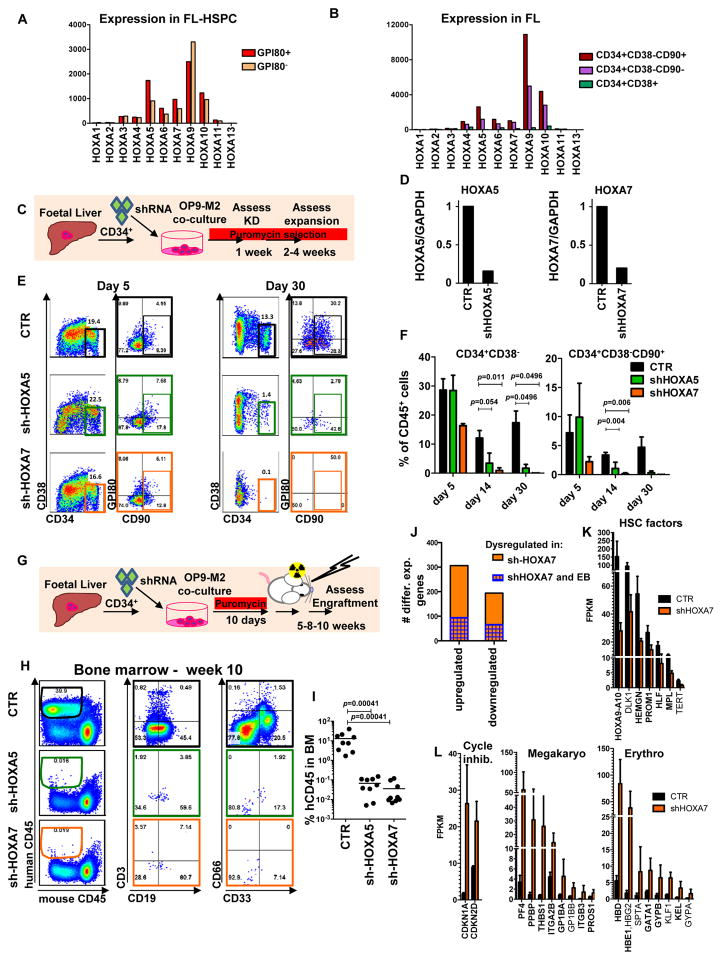
Figure 4. Medial HOXA genes govern the function and identity of human foetal HSPCs.
(A, B) Microarray analysis of HOXA gene expression in CD34+CD38−/lo CD90+GPI-80+ cells and their progeny (Mean values are shown, left, n=3 samples, GEO database GSE54316, and right, n=3 samples (CD34+CD38-CD90+) or 2 (CD34+CD38-CD90- and CD34+CD38-) GSE34974. (C) Schematic showing the strategy for lentiviral shRNA knockdown of HOXA5 or HOXA7 in FL-HSPCs. (D) Knockdown is confirmed using q-RT-PCR 1 week post-infection (mean +/- SD shown from n=3 different FL samples). (E) Representative FACS plots 30 days after HOXA5 or HOXA7 knockdown. (F) Quantification of HSPC subsets in empty-vector (CTR) and shRNA infected cells (shHOXA5 or shHOXA7) after 5, 14 and 30 days in culture (mean and SEM, n=6 independent experiments per condition for day 14 and n=3 for day 5 and 30). Statistical significance was assessed using Wilcoxon Signed Rank test. (G) Schematic showing the transplantation strategy with HOXA5 or HOXA7 knockdown FL-HSPCs. (H) Representative FACS plots from mouse BM 10 weeks post-transplantation assessing human CD45+ cells and multi-lineage engraftment (CD19 and CD3 for B-and T-lymphoid, and CD66 and CD33 for myeloid). (I) Quantification of human engraftment (n=9 mice per condition from 3 independent experiments Individual values and mean are shown.) Statistical significance was assessed using the Wilcoxon Rank Sum test (J) RNA-sequencing of HOXA7 knockdown FL-HSPCs at day 5 post-infection. Number of genes up- or down-regulated in shHOXA7 FL-HSPCs are shown. Genes dysregulated both in HOXA7 knockdown FL-HSPCs (RNA-seq 1.8-fold change, n=4 independent experiments, p-value < 0.05) and in EB-OP9-HSPCs compared to FL-HSPCs (microarray, 2-fold change, p-value < 0.05) are shown in blue pattern overlay. (K) Examples of HSC factors downregulated in HOXA7 knockdown FL-HSPCs and (L) differentiation associated genes upregulated in HOXA7 knockdown FL-HSPCs. Mean shown for n=4 independent specimens, values used to generate graphs can be found in Supplementary Table 4 and GEO database GSE76685). See Supplementary Table 7 for Statistics source data for 4D, F and I.

