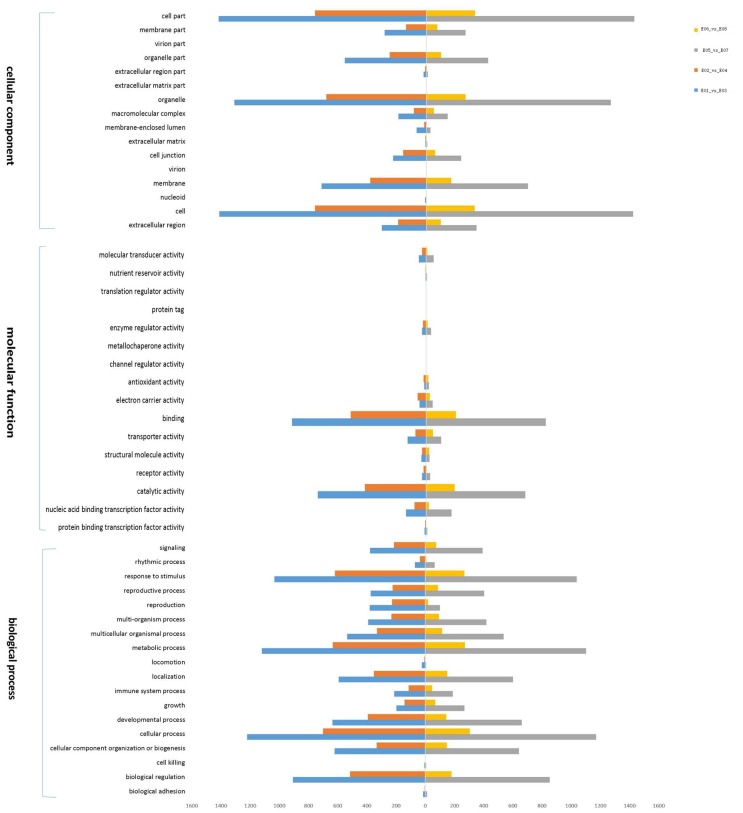
Fig 6. Gene Ontology (GO) functional annotation of differentially expressed genes based on RNA-Seq data in E01 vs E03 (blue), E02 vs E04 (dark red), E05 vs E07 (purple) and E06 vs E08 (yellow).
The three main categories (biological process, cellular component, and molecular function) were used for GO analysis.

