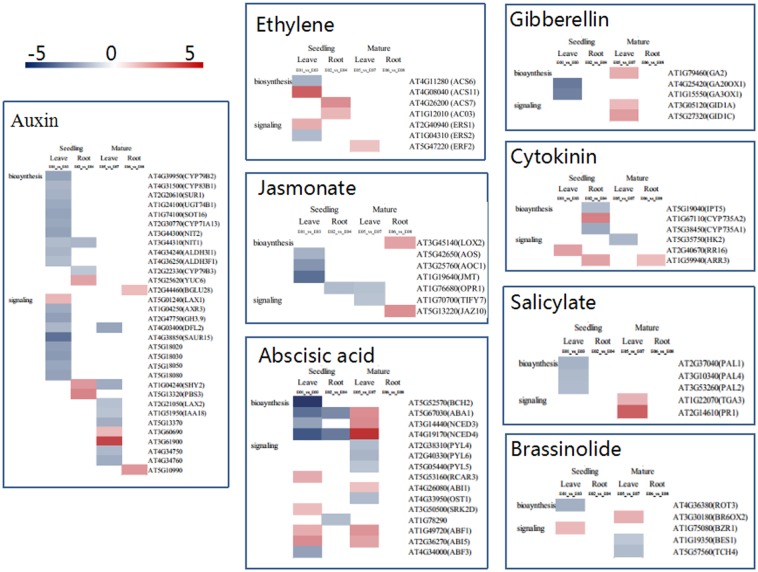
Fig 8. Representative gene expression profiles of hormone biosynthesis and signaling pathways in leaves and roots at seedling and mature stages.
Only DEGs are shown in the heat map. Each color spot reflects the expression of a corresponding gene. Red indicates the upregulation of gene expression, blue represents the genes were downregulated, and white indicates that no signal was detected at RNA level.

