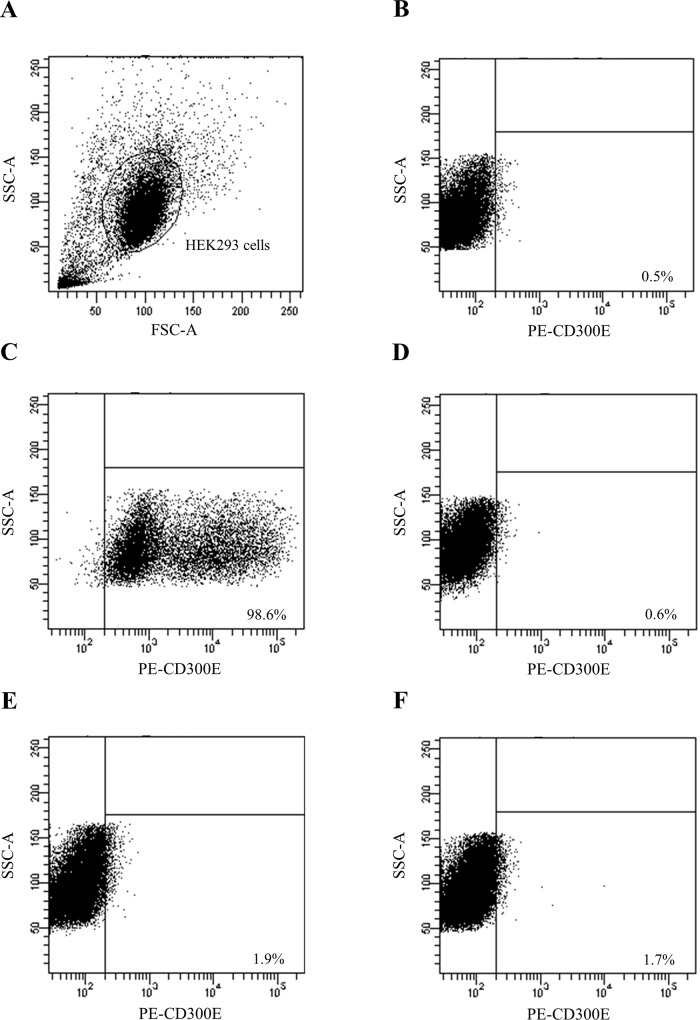
Fig 3. Specificity analysis of ELISAs by performing flow cytometry.
Representative plots shows CD300e-transfected HEK293 cells (A) showing negative isotype control (B) or positive control by using PE-h CD300e antibody (C) or CD300e+ HEK293 cells by using sera from one HC (D) or CD300e+ HEK293 cells by using sera from 2 FT1D patients in the acute phase (E and F).

