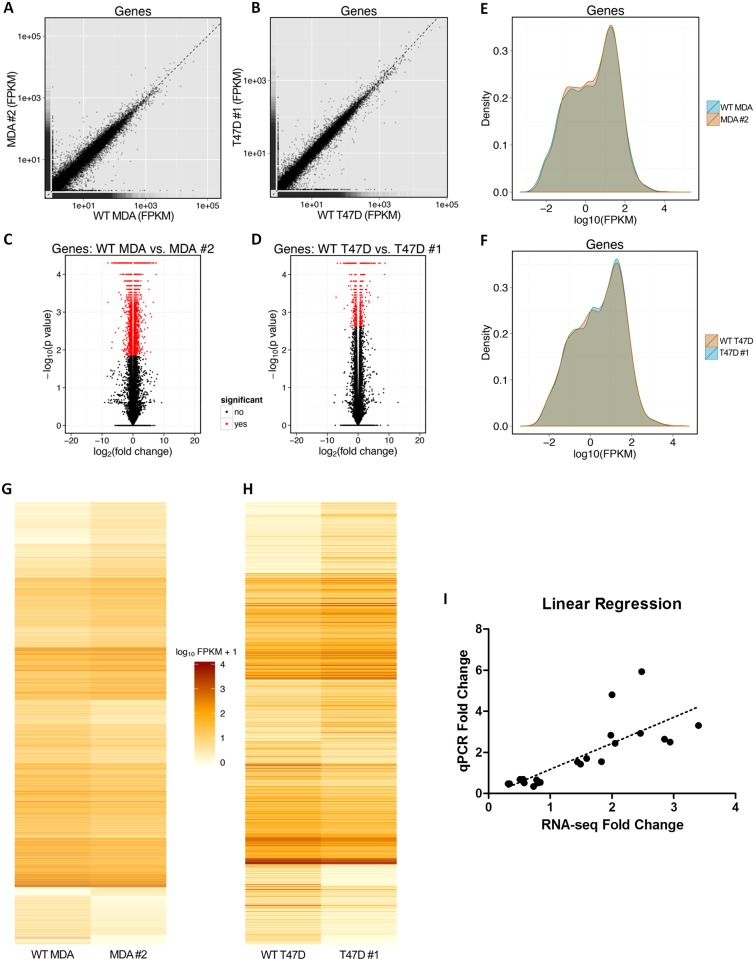
Fig 4. A visual summary of differential gene expression patterns derived from RNA-sequencing data.
Scatter plots illustrate overall gene expression similarities and differences between (A) wild-type (WT) MDA-MB-231 (MDA) cells and MDA clone #2, and (B) WT T47D cells and T47D clone #1. Volcano plots highlight genes that were differentially expressed between (C) WT MDA cells and MDA clone #2, and (D) WT T47D cells and T47D clone #1. Density plots illustrate expression level distribution, with non-overlapping segments representing differential gene expression between (E) WT MDA cells and MDA clone #2, and (F) WT T47D cells and T47D clone #1. Heatmaps illustrate the level of gene expression [in log10(FPKM+1)] for genes that were differentially expressed between (G) WT MDA cells and MDA clone #2, and (H) WT T47D cells and T47D clone #1. FPKM: fragments per kilobase of transcript per million mapped reads. (I) Linear regression analysis of qPCR results compared with RNA-sequencing results. All pairwise comparisons and a wide range of fold-changes are represented in the analysis. Regression revealed high concordance between the two methods.

