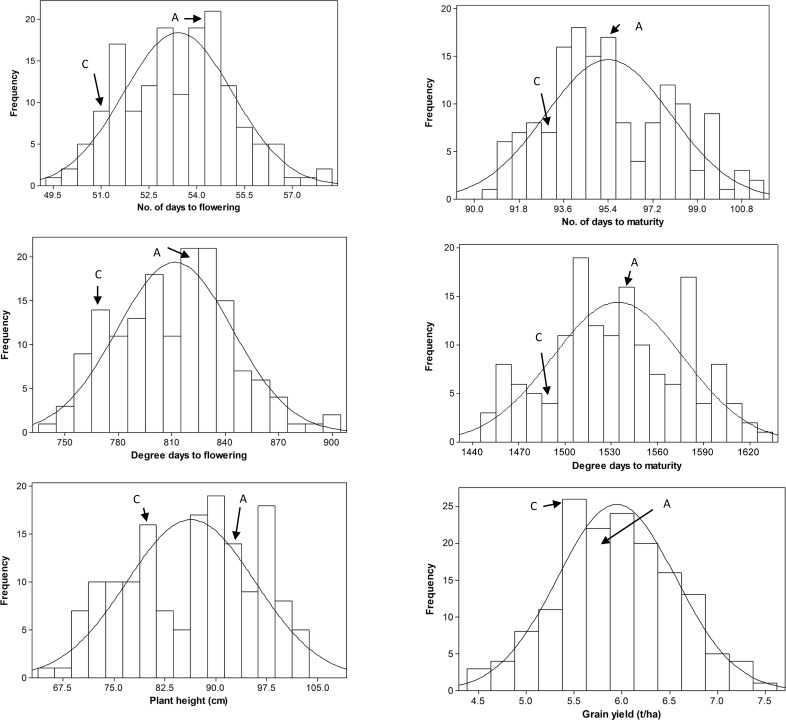
Fig 1. Frequency distribution of least square means computed from the combined data of five environments.
The arrows indicate values of the two parents (C = Cutler; A = AC Barrie). ‘Cutler’ flowered and matured 2.6 days earlier, 12.9 cm shorter but produced 154.9 kg ha-1 lower grain yield than ‘AC Barrie’.

