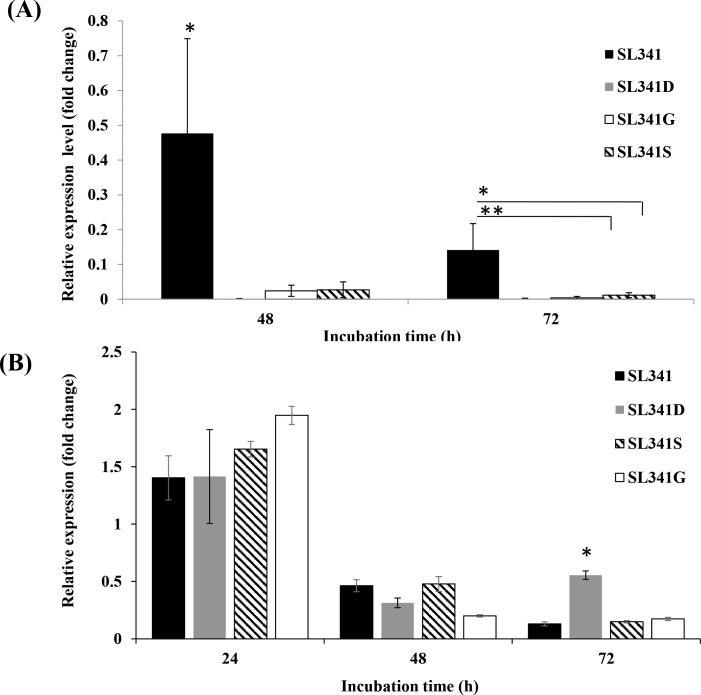
Fig 4. Relative expression of hppD gene and hmgA gene in Ralstonia solanacearum strains.
Time-course mRNA expression of (A) hppD gene and (B) hmgA gene in strains SL341, SL341D, SL341S, and SL341G in minimal medium supplemented with tyrosine, as analyzed by RT-qPCR. The expression level of hppD and hmgA was normalized to that of the V3 region of the 16S rRNA gene as a reference. Vertical bars represent the standard deviation of three biological replicates. Asterisks above bar represent the significant difference among strains (“*”, p<0.05 and “**”, p<0.01 by Tukey’s test).

