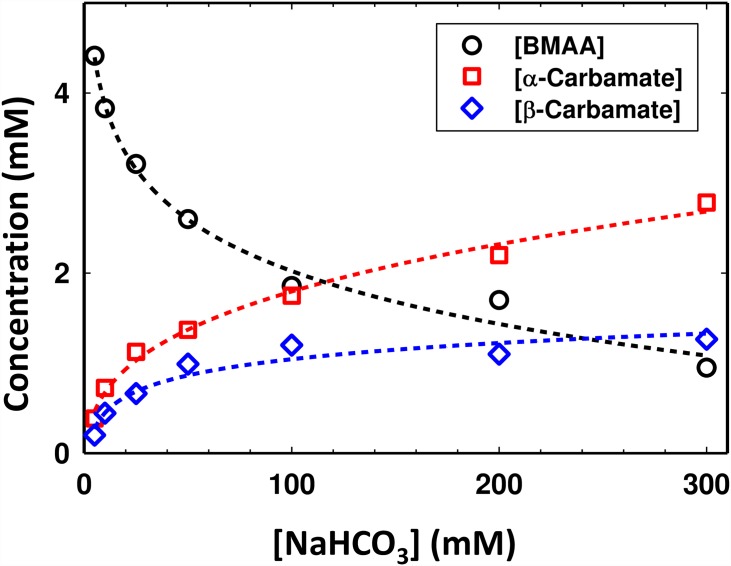
Fig 3. Formation of α-carbamate and β-carbamate in the equilibrium process and its dependence of concentration of bicarbonate ions in the solution.
Estimation of the total concentration of different species in solution [BMAA] (black circles), [α-carbamate] (red squares) and [β-carbamate] (blue diamonds) as a function of increasing HCO3- ([NaHCO3]) concentration. The concentrations of each species were determined using one-dimensional 1H NMR spectroscopy. The concentration of the initial BMAA was 5 mM and all the experiments were performed at a pD of 7.6 and at 30°C.

