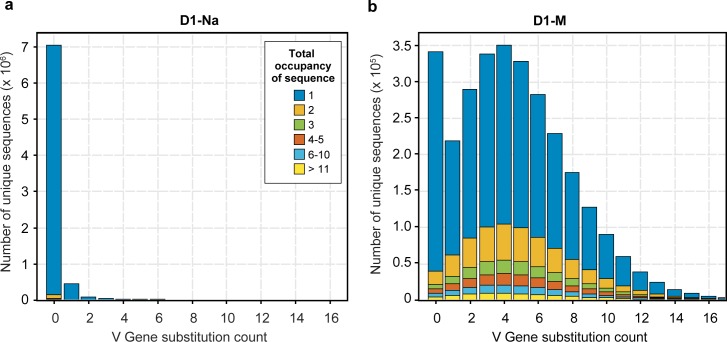
Fig 5. Comparison of Somatic Hyper Mutation in paired naive and memory B-cell samples from the same donor.
The figure shows data for the naive (a) and memory sample (b) from Donor 1, which is representative of all three donors. The x-axis corresponds to the number of substitutions differing from the germline V gene sequence, and the y-axis indicates the number of unique sequences that display that number of substitutions. The colors indicate different total well occupancies, with blue indicating singletons present in just one well, and the other colors showing progressively higher well occupancy, as indicated in the figure. The majority of the sequences in the naive B-cell sample have 0 substitutions and correspond to low abundance clones observed in a single well (blue). In contrast, the memory B cell sample from the same individual shows a much broader distribution of substitutions, as well as many more sequences with occupancy greater than 1.

