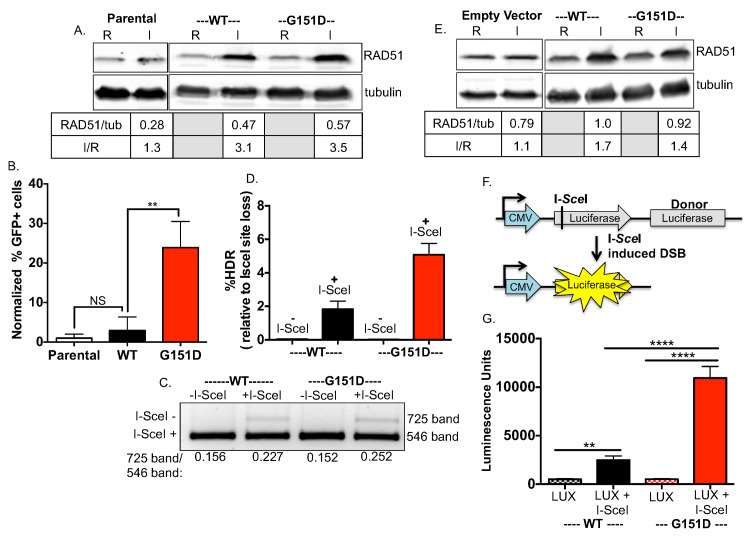
Fig 1. Enhanced HDR of chromosomal DSBs in cell lines expressing RAD51 G151D.
A. RAD51 WT and G151D were stably expressed in MCF7 cells harboring the I-SceI reporter construct using the pRVY TET-OFF inducible expression vector. The addition of doxycycline to the media turns off exogenous RAD51 expression (repressed, abbreviated R; endogenous RAD51 protein levels only), with expression induced upon removal of DOX (induced, abbreviated I; endogenous levels + exogenous protein levels). Western blot with an antisera raised against RAD51 protein demonstrates equivalent expression of exogenous WT and G151D (I) in their respective MCF-7 DR-GFP pools (RAD51/tubulin), as well as the fold increase in expression over endogenous RAD51 (I/R). B. The percentage of GFP positive cells was measured by flow cytometry 72hrs after nucleofection with an I-SceI expression vector. The percentage of GFP-positive cells from MCF-7 DR-GFP parental cells was normalized to 1 and the relative change of percent GFP-positive cells from MCF-7 DR-GFP RAD51 WT and G151D cells was calculated. Data are graphed as mean ± SD from 3 independent experiments ** p<0.01. C,D. Analysis of I-SceI site loss (C) and percent HDR relative to I-SceI site loss (D). PCR amplification of the DR-GFP cassette was performed using genomic DNA as a template isolated from RAD51 WT or RAD51 G151D expressing MCF-7 DR-GFP cells nucleofected without DNA or with the I-SceI expression vector. C. To determine the percent I-SceI site loss, the 725bp and 546bp bands from each lane were quantified using Quantity One software. Representative agarose gel demonstrating the digested PCR products. I-SceI (-) labels the 725bp band indicative of I-SceI site loss; I-SceI (+) labels the 546bp indicative of maintenance of the I-SceI site. D. The percent HDR was calculated by dividing the percent GFP+ cells by the percent I-SceI site loss after nucleofection of the I-SceI expression vector or no DNA. The graphed percentages are the mean ± SD of 3 independent experiments. E. Western blot demonstrates equivalent expression of exogenous WT and G151D (I) in their respective MCF10A pools (RAD51/tubulin), as well as the fold increase in expression over endogenous RAD51 (I/R). F. Schematic of the HDR luciferase reporter assay. The I-SceI recognition site is located within the luciferase ORF, disrupting luciferase expression. A luciferase donor DNA (lacking a promoter) is located downstream as a template for HDR. Co-expression of the I-SceI endonuclease and luciferase reporter results in DSB formation in the luciferase reporter construct. G. The I-SceI luciferase reporter (LUX) and I-SceI nuclease (I-SceI) were nucleofected into MCF10A RAD51 WT or G151D expressing cells. Cell lysates were collected 24 hours post-transfection and assayed for luciferase activity. Relative luminescent units for RAD51 WT or G151D expressing MCF10A cells nucleofected with the I-SceI luciferase reporter (LUX) alone (control for background levels) or in combination with I-SceI nuclease (I-SceI) are graphed. Error bars are SEM (n = 2).

