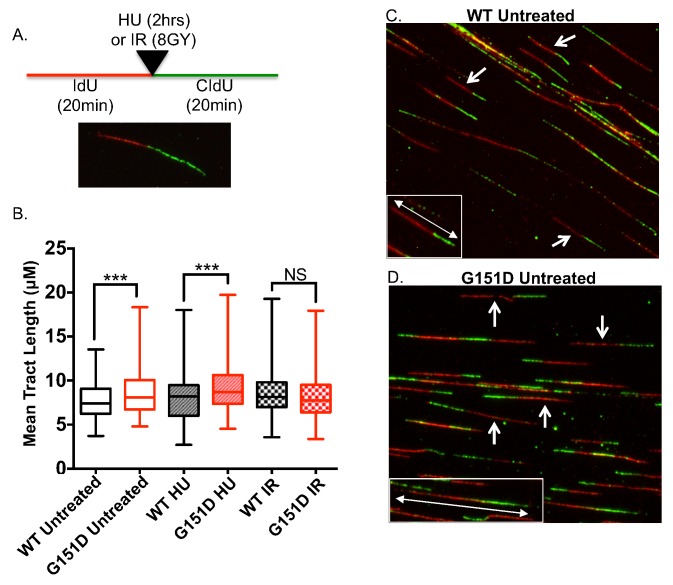
Fig 9. Increased replication fork tract length in MCF10A cells expressing RAD51 G151D.
A. Schematic of the experimental setup for the DNA fiber assay and a representative image of an elongating replication fork, which was the replication structure exclusively used to measure replication tract length. B. Replication tract length of elongating replication forks measured by DNA fiber assay in untreated, HU-treated (0.5mM for 2 hrs), or IR-treated (8GY) MCF10A cells expressing RAD51 WT or G151D. >100 replication tracts were measured for MCF10A RAD51 WT or G151D expressing cells for each treatment group. Data are representative of 3 independent experiments. Graphed as mean ± SD. C,D. Representative images of images of untreated MCF10A RAD51 WT or G151D expressing cells. Arrows indicate representative elongating replication fork structures used to measure replication tract length. Insets highlight representative replication tracts for RAD51 WT (C) and RAD51 G151D (D) cells.

