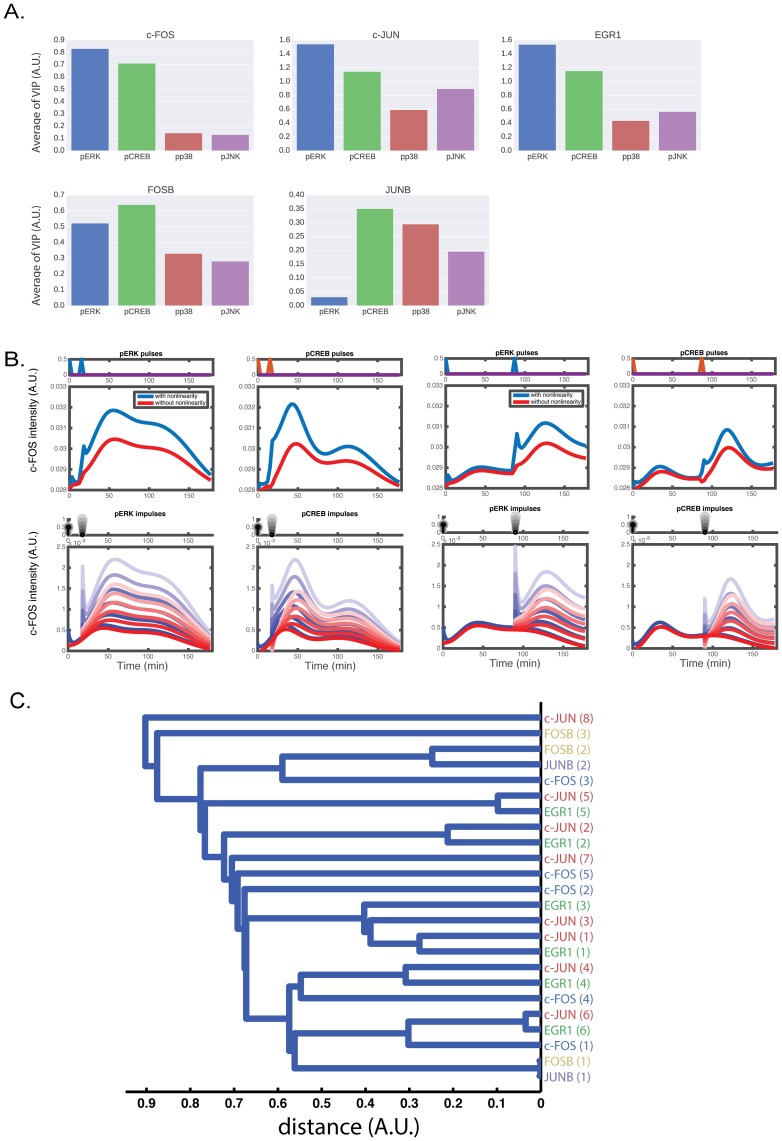
Fig 4. The mean VIP score and a dendrogram based on hierarchical clustering of input loading.
(A) Averaged VIP scores of the input. (B) Computational and theoretical c-FOS time course given two pulsatile and impulsive pERK and pCREB inputs. For the top panels, c-FOS time course was simulated when two pulses were given as inputs. The bottom panels show the theoretical impulse responses when two impulses were given as inputs. The amplitude of the second impulse was tuned from 0 to 1. The calculation with nonlinear model is shown in blue and without nonlinearity is shown in red. (C) Hierarchical clustering as applied to the input loadings. The distance between two samples is defined as 1-r where r is the Pearson correlation. The distance between two clusters is defined as the shortest distance between two samples drawn from each of the clusters. The leaf nodes represent the output loadings, and the order of principle components is described in parenthesis. The loadings and scores of the input and output used for principal component analysis are shown in S5 Fig.

