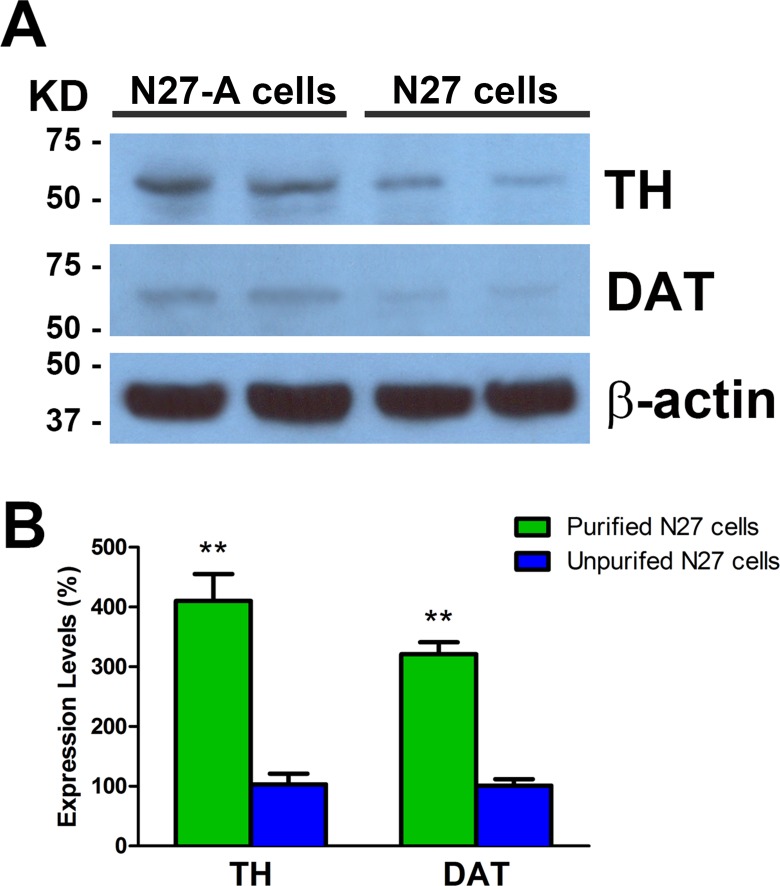
Fig 5. Western blots for TH and DAT in purified N27-A and unpurified N27 cells.
(A): Representative images show TH, DAT and β-actin Western blots from purified and unpurified N27 cells. Strong TH bands were seen in purified N27-A cells, while much reduced TH protein levels were seen in unpurified N27 cells. There were moderate DAT protein levels in purified N27-A cells but only faint DAT bands in unpurified N27 cells. (B): Quantification of TH and DAT Western blots relative to β-actin bands. The TH and DAT levels in unpurified N27 cells were set at 100%. Results show that purified N27-A cells have four-fold higher TH and three-fold higher DAT protein levels compared to unpurified N27 cells. (n = 6, **p<0.01)

