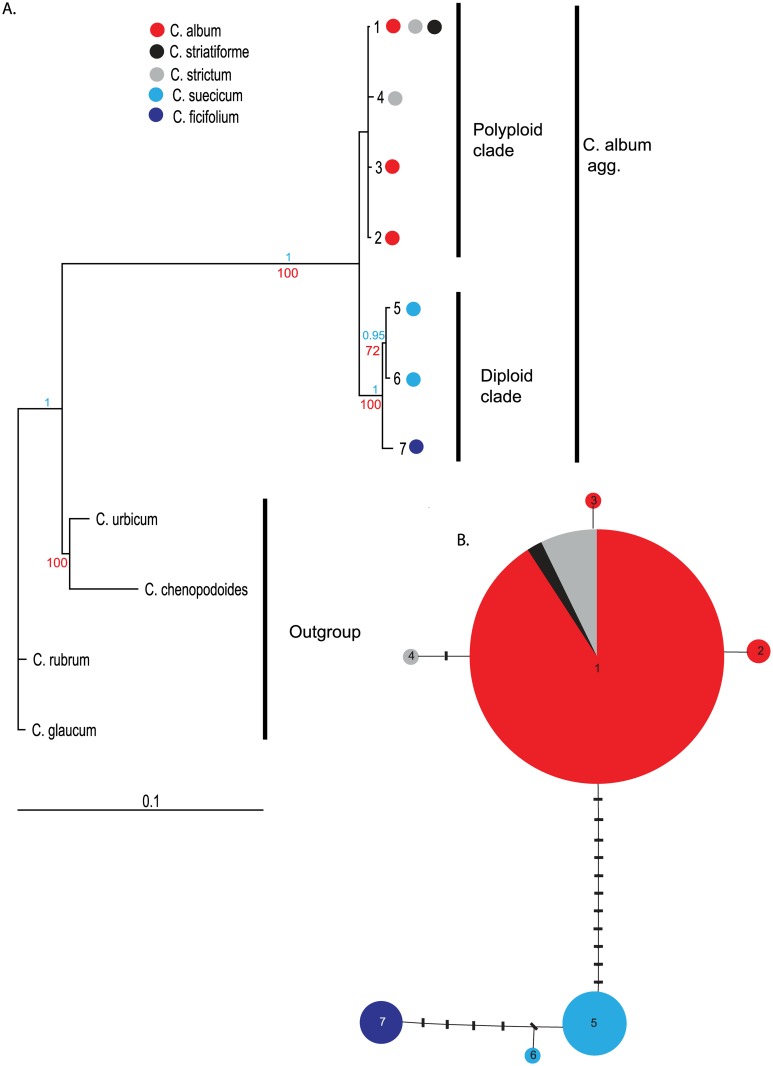
Fig 1. Analysis of cpDNA haplotypes.
(A) A 50% majority rule consensus tree of the Bayesian analysis. The designated haplotype numbers are in accordance with Table 1; each haplotype is represented by one sequence. Numbers above and below branches indicate posterior probability (blue) and bootstrap support (red) values from Bayesian and maximum parsimony analysis, respectively. The presence of the particular haplotypes in species of the Chenopodium album agg. is indicated by coloured dots (see legend). (B) A cpDNA haplotype network. Each line represents one mutational step. Black bars represent missing haplotypes. The seven haplotypes identified in this study are represented by coloured circles. The size of each circle is proportional to the frequency of the particular haplotype. The occurrence of particular haplotypes in species of the C. album agg. is indicated by colours (see legend).

