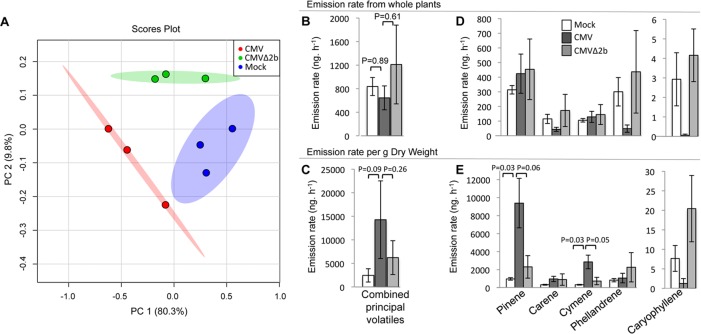
Fig 4. Virus infection induced quantitative and qualitative changes in the emission of volatile organic compounds by tomato plants.
(A) Score scatter plot from principal component (PC) analysis of m/z values (binned to 1.0 Da) obtained by gas chromatography-mass spectrometry of samples of volatile organic compounds (VOCs) collected by dynamic headspace trapping from tomato plants that had been mock-inoculated (blue), infected with CMV (strain Fny) (red) or CMVΔ2b-infected (green). The analysis shows discrimination between all three treatments. The percentage of variation of the data explained by PC1 and PC2 is in parentheses (80.3 and 9.8%, respectively). (B) Whole plant total emission rate (ng.h-1) of the combined (most abundant) volatiles is similar for mock-inoculated and virus-infected plants. (C) VOC emission rate (ng.h-1) per gram dry weight of the combined (most abundant) volatiles is highest from CMV-infected plants compared to mock-inoculated and CMVΔ2b-infected plants. (D) Whole plant VOC emission rate (ng.h-1) for the five most abundant volatiles from mock-inoculated, CMV-infected and CMVΔ2b-infected tomato plants. (E) VOC emission rate (ng.h-1) per gram dry weight of the five most abundant volatiles from mock-inoculated, CMV-infected and CMVΔ2b-infected tomato plants show that pinene and cymene emission are significantly higher in CMV-infected plants compared to mock-inoculated and CMVΔ2b-infected plants. The mean VOC emission values for combined or individual volatiles are presented (n = 3 plants per treatment). Error bars represent standard error of the mean. The level of significance is shown by a p-value calculated with one-way ANOVA and post hoc Tukey HSD testing.

