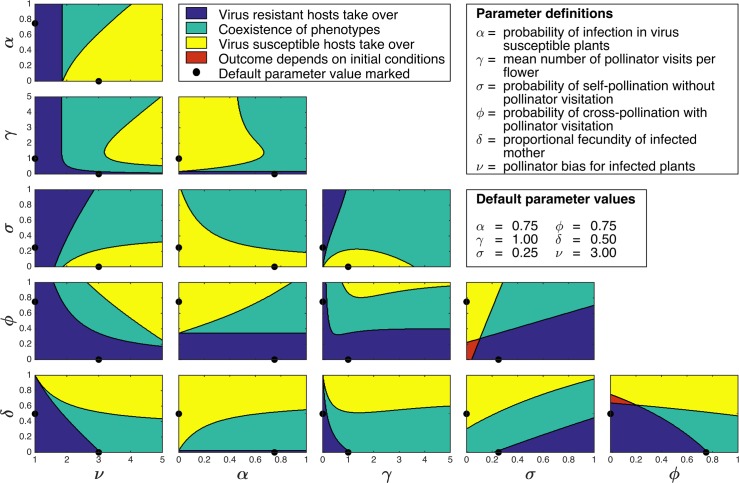
Fig 8. Virus susceptible plants persist across a broad range of parameter values.
A full two-way sensitivity analysis of the model, showing the effect of independently changing pairs of parameters (all other parameters fixed). The virus susceptible genotype takes over (yellow) or co-exists with the resistant genotype (green) across a large proportion of parameter space. All pair-wise combinations of two parameters are shown: dots on each axis show default values of each parameter.

