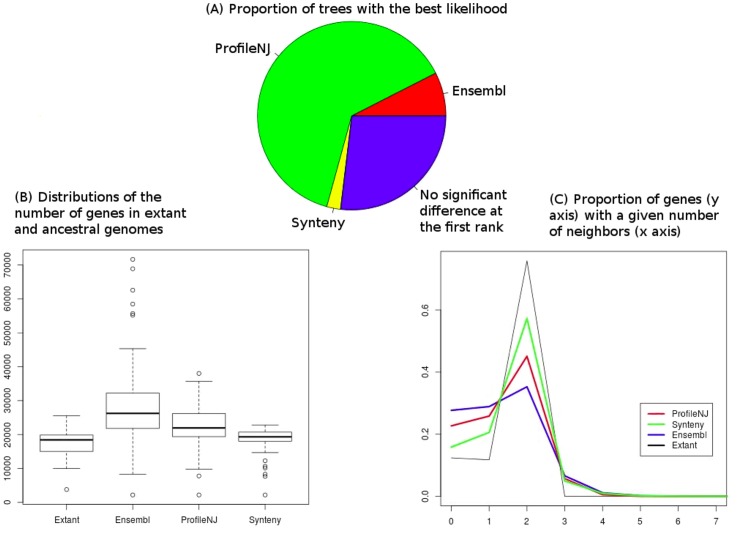
Fig 6. Sequence likelihood, ancestral genome content and ancestral chromosome linearity for ProfileNJ, Synteny and Ensembl trees.
(A) Proportion of trees with a significantly better likelihood computed with PhyML. AU tests were computed for the three trees for each family, and if the tree at the first rank was significantly better than the second, it was stored as the best likelihood, and if not, it was stored as “no significant difference at the first rank”. (B) Gene content computed with DeCo. Gene content has one value for each node of the phylogeny of 63 species, except for extant genomes, for which it has one value for each leaf. (C) Genome linearity computed with DeCo. Genome linearity is represented by a graph, whose x axis is the number of neighbors a gene can have, and the y axis shows the proportion of genes having this number of neighbors. Parameters from extant genomes are given as a reference in (B) and (C). Statistics for ancestral genomes are assumed better when close to the extant ones.

