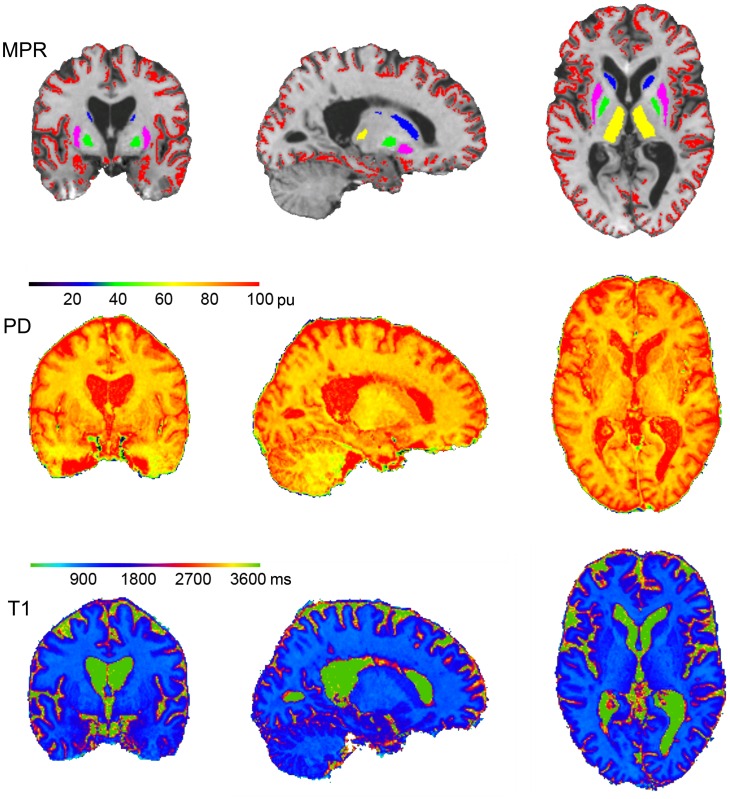
Fig 1. Representative example for calculated quantitative maps and segmentation of the synthetic anatomical MP-RAGE data set.
synthetic MP-RAGE data (top) with an overlay showing the identified volumes of the cortex (red) and deep gray matter structures in colors (caudate nucleus in blue, thalamus in yellow, putamen in pink and pallidum in green), the PD map (second row) and T1 map (bottom). All data are shown for three orthogonal slices in MNI 152 standard space (center x = 19.00, y = -2.00, z = 3.00).

