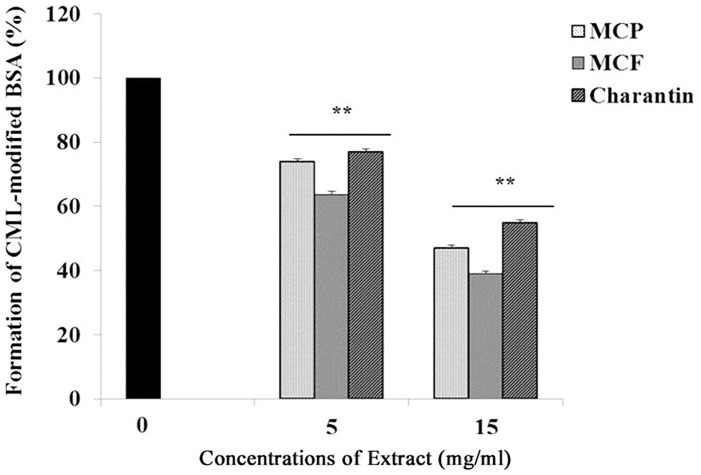
Fig 2. Effects of different concentrations of MCP, MCF and charantin on CML formation.
The bar graph shows the effect of different concentrations (5 and 15 mg/ml) of the MCP, MCF and charantin extracts on production of CML following glycoxidation of BSA (300 mg) in 0.2 M phosphate buffer, pH 7.8 at 37°C over a period of 24-hours. The positive control was the amount of CML-modified BSA produced in the absence of extracts. The results are presented as mean ± SD (n = 3), **: p < 0.01 vs control.

