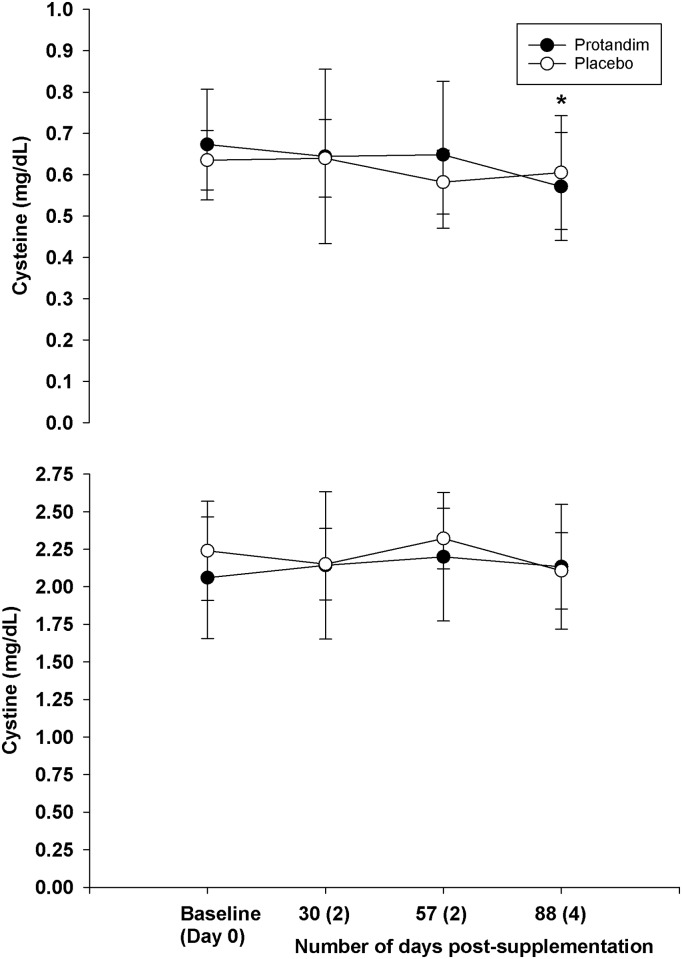
Fig 5. The long terms effects of supplementation on cysteine and cystine (rest, fasted state).
There was no difference between groups for either variable (p = 0.60 for cysteine, p = 0.52 for cystine). For cysteine, there was a difference at 88 days post-supplementation compared to baseline (p = 0.013). Mean values represented by circles, error bars represent SD. The x-axis represents the mean (SD) of the number of days post-supplementation.

