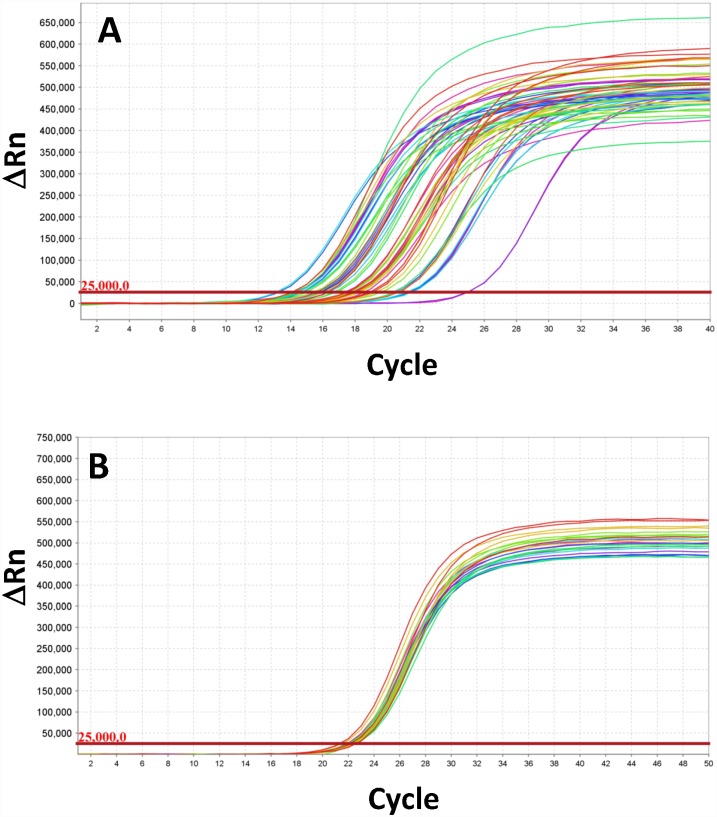
Fig 2. Amplification of undiluted and diluted (normalized) DNA samples.
Comparison of amplification curves generated using COI lymantriine general primers (S1 File, tab 1) on multiple, undiluted samples (A), and those obtained from the same samples following dilutions calculated to achieve the Ct of 22–23 (B).

