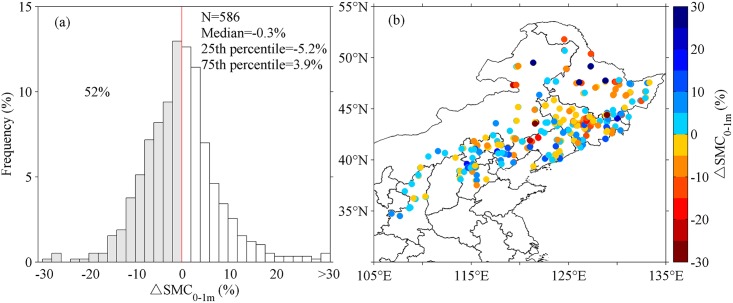
Fig 3. Changes of top 1-m soil moisture content (ΔSMC0-1m) in afforested plots (N = 586).
(a) Frequency distribution of ΔSMC0-1m; (b) Spatial distribution of ΔSMC0-1m. In panel (a), the median, 25th and 75th percentile of ΔSMC0-1m are displayed in texts. Negative ΔSMC0-1m is found in 52% of the plots.

