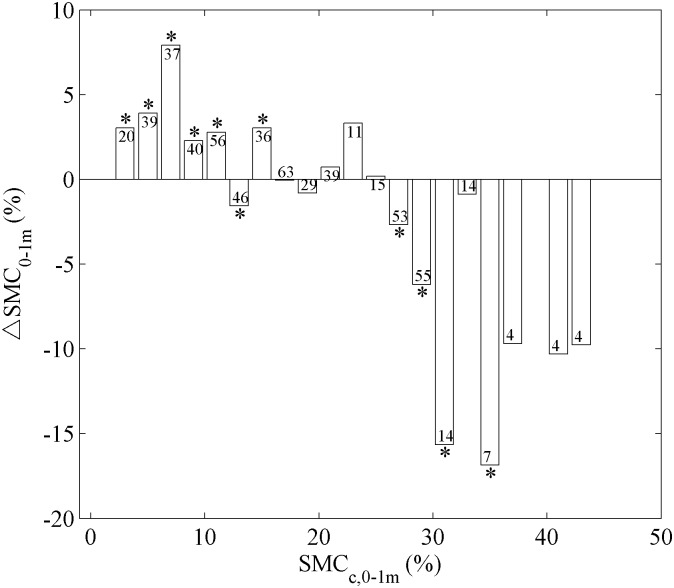
Fig 4. Relationships between the change of top 1-m soil moisture content (ΔSMC0-1m) and the top 1-m soil moisture content in control plots (SMCc,0-1m).
SMCc,0-1m was divided into bins by every 2% SMCc,0-1m. The numbers on top of the bars refer to the number of plots falling into each group. The asterisks (*) indicate significantly (P < 0.05) positive or negative non-zero ΔSMC0-1m depended on the median of ΔSMC0-1m.

