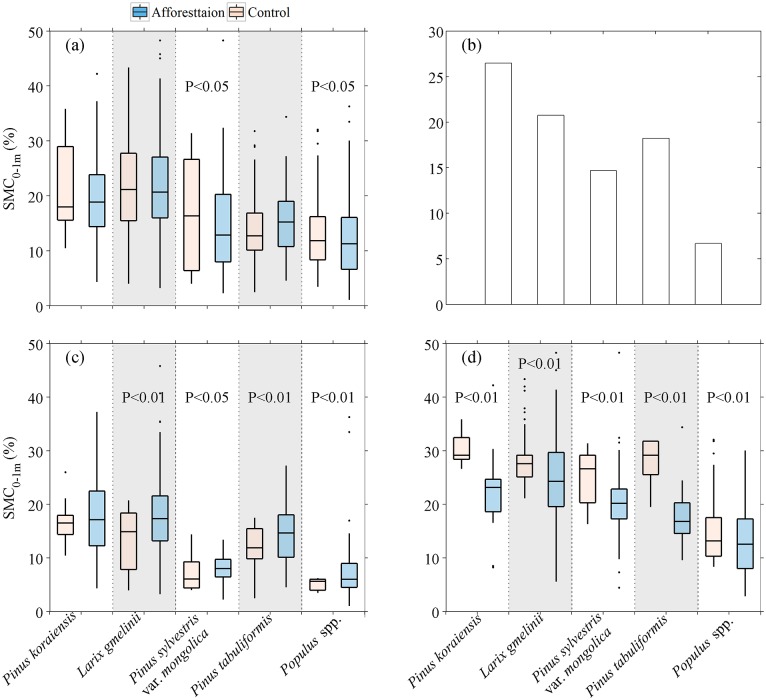
Fig 5. Soil moisture content of top 1-m (SMC0-1m) in control and afforested plots under different afforestation tree species.
(a) SMC0-1m in control and afforested plots. (b) The thresholds of top 1-m soil moisture content in control plots (SMCc,0-1m) when the change of top 1-m soil moisture content (ΔSMC0-1m) turns from positive to negative under different tree species, (c) SMC0-1m in control and afforested plots when SMCc,0-1m are below the threshold, and (d) above the threshold. In panel (a) and (d), the text P < 0.05 and P < 0.01 denote significantly and extremely significantly decrease in SMC0-1m in afforestation plots compared to control plots. In panel (c), the text P < 0.05 and P < 0.01 denote significantly and extremely significantly increase in SMC0-1m in afforestation plots compared to control plots. In box plots, the whiskers and boxes indicate the minimum, 25th percentile, median, 75th percentile and maximum.

