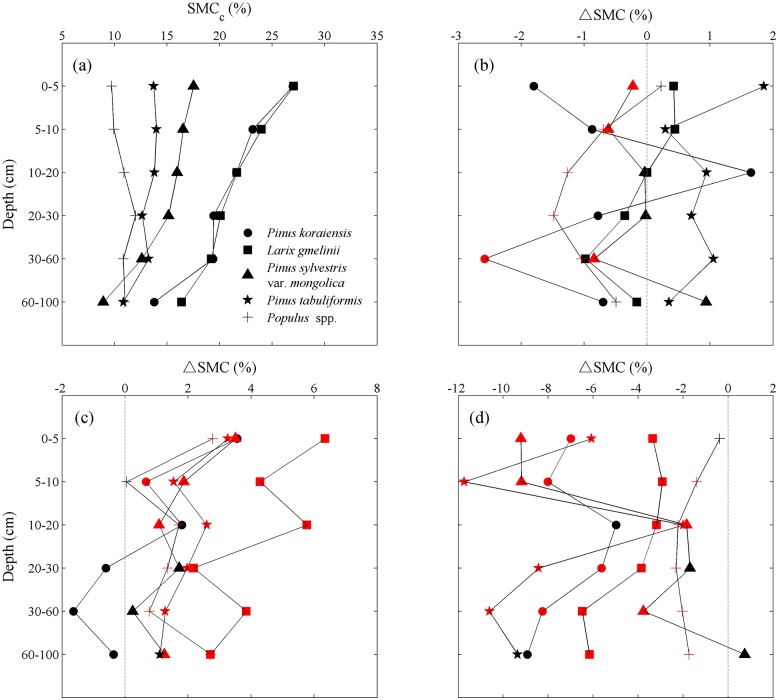
Fig 6. Vertical distribution of: (a) soil moisture content (SMC) in control plots, (b) the change of soil moisture content (ΔSMC), (c) ΔSMC when top 1-m soil moisture content in control plots (SMCc,0-1m) are below the threshold (threshold values are shown in Fig 5b), and (d) above the threshold under different tree species for six different soil depths (0–5 cm, 5–10 cm, 10–20 cm, 20–30 cm, 30–60 cm, 60–100 cm).
In panel (b) and (d), the red points indicate a significant decline of SMC in afforestation plots compared to control plots (P < 0.05). In panel (c), the red points indicate a significant increase of SMC in afforestation plots compared to control plots.

