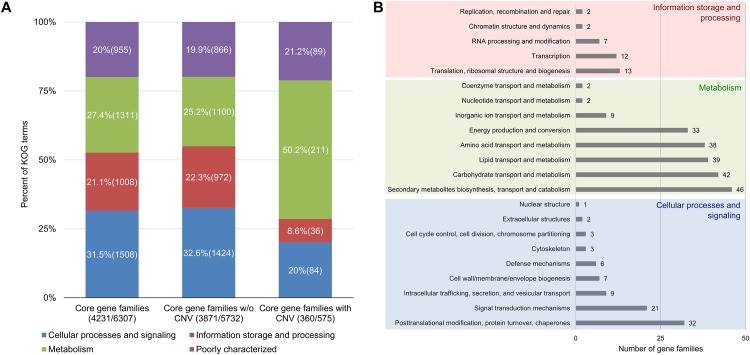
Fig 5. Distribution of KOG annotation profiles in core gene families with or without copy number variation (CNV) among Pseudocercospora musae, Pseudocercospora eumusae, and Pseudocercospora fijiensis.
(A) Plotted in the different segments of the stacked bars is the percent of KOG terms assigned to core gene families (column 1), core gene families without (w/o) copy number variation (CNV) (column 2), and the core gene families with CNV (column 3), for each of the main functional categories of KOG (Cellular processes and signaling: blue; Information storage and processing: red; Metabolism: green; and Poorly characterized: purple). The number in the parenthesis of each segment in the columns refers to the number of KOG terms assigned to the gene families for each specific functional category of KOG. The first number in the X-axis label of each comparison refers to the total number of gene families with assigned KOG terms, whereas the second number refers to the total number of gene families in each comparison compartment. A high fraction (211, 50.2%) of the total number of 420 KOG terms that were collectivity assigned to gene families with CNV was ascribed to metabolism. (B) The number of gene families with CNV assigned to each subcategory of KOG. A high number of gene families (46) is associated with biosynthesis of secondary metabolites, transoport and catabolism, as well as carbohydrate transport and metabolism (42), lipid transport and metabolism (39), and amino acid transport and metabolism (38). Note that because some gene families receiving KOG annotations could be assigned to more than one functional categories of KOG, the number of KOG terms in this case is equivalent to the number of gene families.

