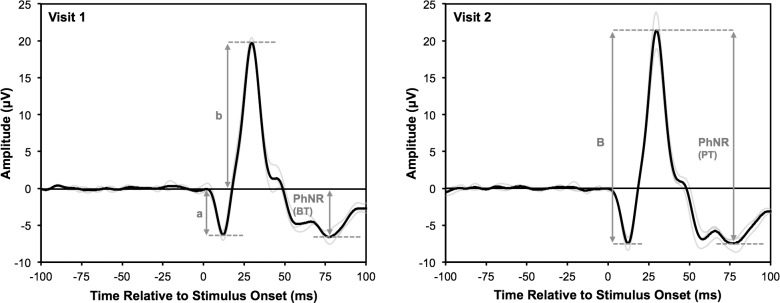
Figure 2.
Parameters of the ERG waveform measured in this study, illustrated on the measurements from the right eye (excluding the first measurement) of one participant over the two sessions, representative of the measurements obtained in this study; individual traces are shown (light gray lines), and all three traces were averaged (black line). The a- and b-wave amplitudes (“a” and “b,” respectively) were measured relative to the baseline, and the b-wave peak to a-wave trough was considered the b-wave amplitude (“B”). The PhNR was measured either from the baseline (BT) or to the b-wave peak (PT).

