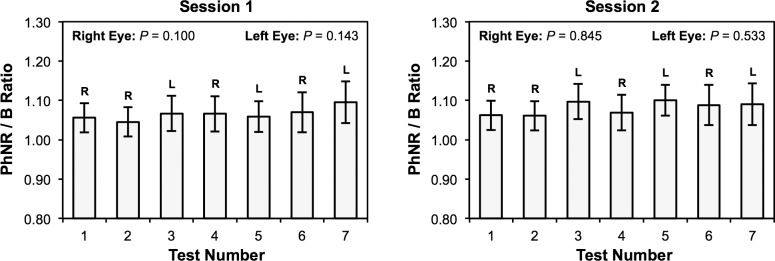
Figure 3.
The mean ratio between the b-wave peak to photopic negative response trough amplitude and b-wave peak to a-wave trough amplitude (PhNR/B ratio) of each eye of all participants over each test during the two separate sessions. No significant differences in the PhNR/B ratio were found between tests for both the right and left eyes at both sessions (P ≥ 0.100). Error bars represent the 95% confidence interval of the mean.

