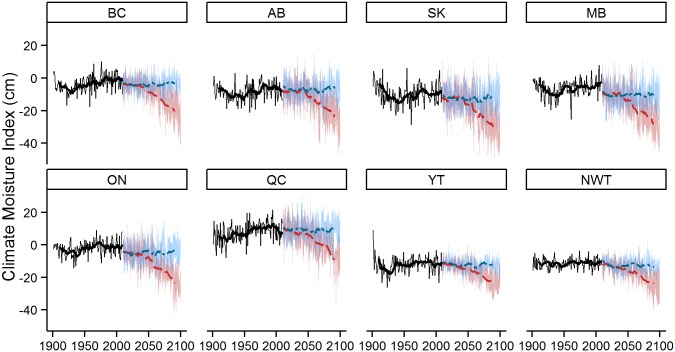
Fig 2. Historical and future CMI values under RCP 2.6 and 8.5 for all GCMs.
The blue and red shaded regions (RCP 2.6 and RCP 8.5 respectively) reflect the yearly maximum and minimum CMI estimates under the four GCMs; the model average is represented by the blue (RCP 2.6) or red (RCP 8.5) dashed line. A ten year historical moving average from 1901 to 1979 is represented by the solid black line.

