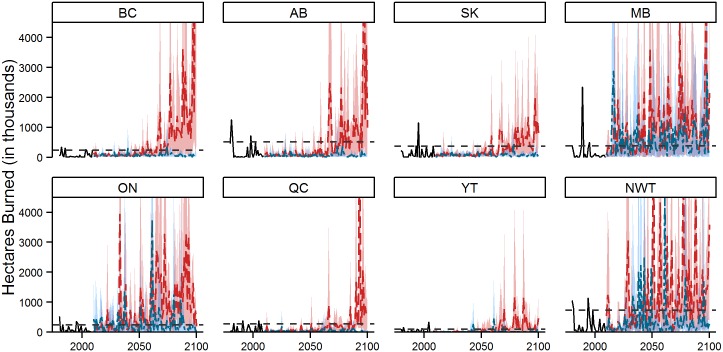
Fig 5. Area burned as forecast under RCP 2.6 and 8.5 for all GCMs.
The blue and red shaded regions (RCP 2.6 and RCP 8.5 respectively) reflect the yearly maximum and minimum area burned estimates under the four GCMs; the model average is represented by the blue (RCP 2.6) or red (RCP 8.5) dashed line. The black dashed line represents the extreme fire year threshold, defined as the 90th percentile value from the 1980–2009 period. The maximum area burned values for most provinces exceed the chosen scale and are not illustrated; British Columbia: 3.4x10⁷ ha in 2099; Alberta: 2.5x10⁷ ha in 2097; Manitoba: 1.4x10⁷ ha in 2048; Ontario: 1.5x10⁷ ha in 2033; Québec: 3.3x10⁷ ha in 2093; Northwest Territories: 2.9x10⁷ ha in 2051.

