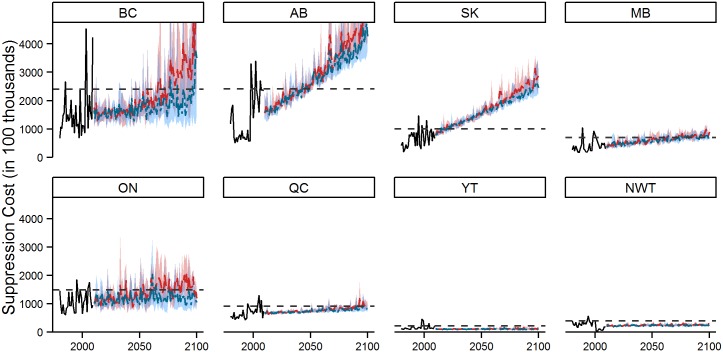
Fig 6. Total suppression costs as forecast under RCP 2.6 and 8.5 for all GCMs.
The blue and red shaded regions (RCP 2.6 and RCP 8.5 respectively) reflect the yearly maximum and minimum total fire cost estimates under the four GCMs; the model average is represented by the blue (RCP 2.6) or red (RCP 8.5) dashed line. The black dashed line represents the extreme fire year threshold, defined as the 90th percentile value from the 1980–2009 period. The maximum total cost values for Alberta and British Columbia are not illustrated within the figure; Alberta: $9.06x10⁸ in 2097; British Columbia: $1.07x10⁹ in 2099.

