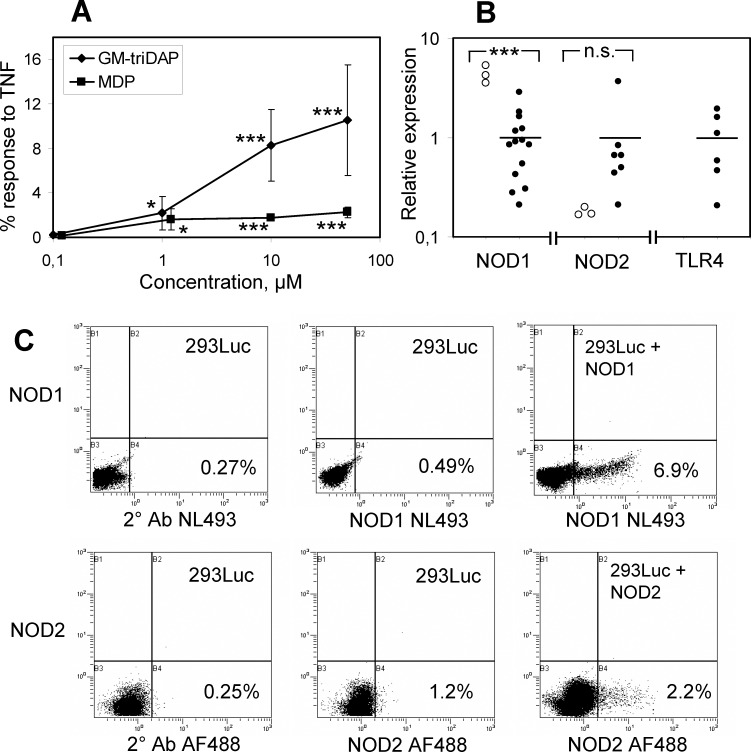
Fig 2. Endogenous expression of NOD1 and NOD2 by the 293Luc cells.
(A) 293Luc cells were stimulated with GM-triDAP or MDP for 24 hrs, whereafter luc2P activity was measured as described in Materials and Methods. Mean ± s.d. of 5 independent experiments. * p < 0.05, *** p < 0.001 compared to unstimulated cells. (B) Relative expression of NOD1, NOD2 and TLR4 mRNA in 293Luc cells (open circles; three independent measurements) and in different monocyte-derived macrophage preparations (closed circles) as measured by RT-PCR. Horizontal lines denote mean mRNA expression in macrophages (adjusted such that it equals 1). *** p < 0.001 by Student’s t-test. TLR4 mRNA was below the level of detection in 293Luc cells. (C) Expression of NOD1 and NOD2 proteins measured by flow cytometry in intact 293Luc cells (middle plots) or 24 hrs after transfection with NOD1 or NOD2 expression plasmids (right plots). Left plots, staining controls (omission of primary antibodies). Both plasmids were used at 2.5 μg per a subconfluent well of a 6-well plate. In all dot plots, percentages of positive cells are indicated; shown is one experiment out of 2 with similar results. NL, Northern lights; AF, Alexa Fluor.

