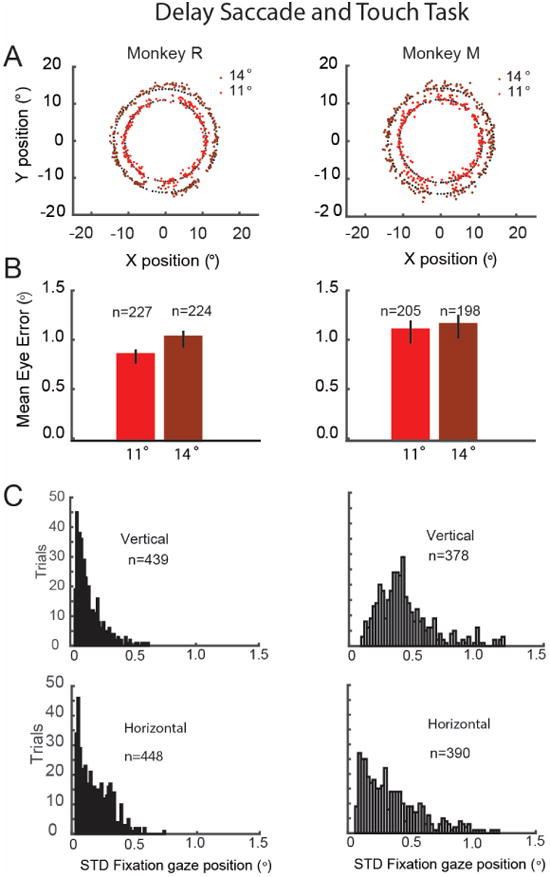
Figure 7.

Oculomatic performance during a delayed saccade and touch task. A. Targets and saccade endpoints. Targets (black dots), and saccade endpoints at 11° and 14° (red dots). B. Mean eye error magnitude for the endpoints depicted in B. Monkey R (11°: 0.82+-0.03 sem; 14°: 1.00 +-0.03sem); Monkey M (11°: 1.07+-0.05; 14°: 1.13+-0.05). C. Histogram of gaze position variability during fixation in the horizontal and vertical axis: Monkey R (horizontal m=0.20+-0.005sem; vertical m=0.11+-0.004), Monkey M (horizontal 0.41+-0.01, vertical: 0.49+-0.01).
