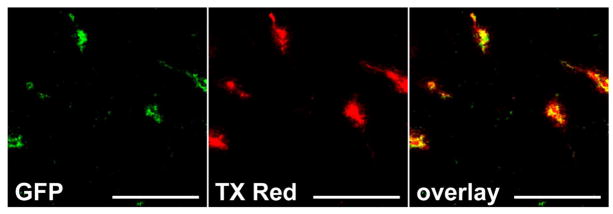
Figure 1. Perfusion of fluorescent tracers label and remain restricted to vessels in brain.
A representative image of Tie-2 driven GFP expression (A) in brain vasculature perfused with TX Red 70kD dextran (B). The overlay (C) of each channel indicates good colocalization and no tracer associated with structures other than brain vasculature. Scale bar = 100μm.

