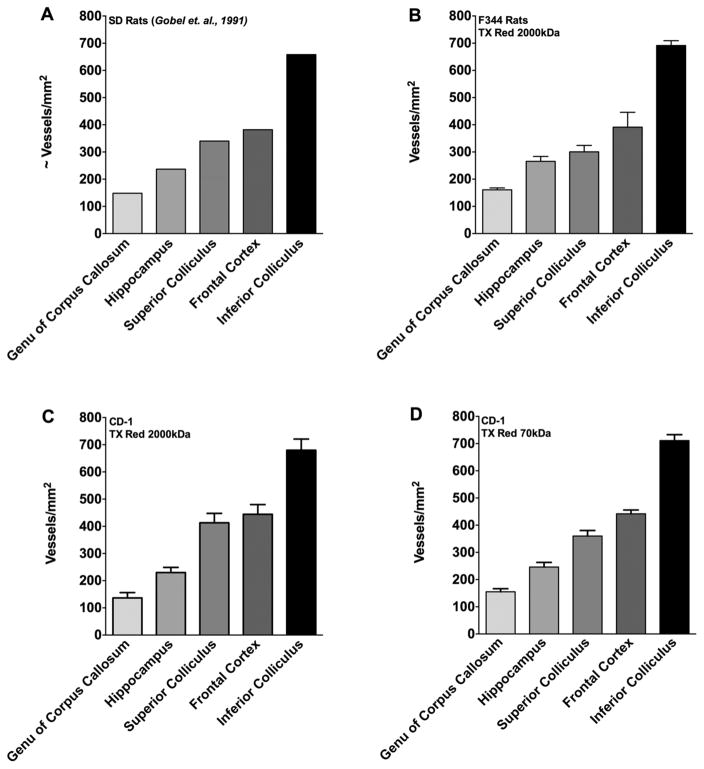
Figure 3. Vascular density of various brain regions.
The quantified vascular density of various brain regions are shown . Panel A represents vascular density in male SD rats (data reproduced with permission from (Gobel et al., 1991). Panel B shows vascular density in F344 rats using (2000kDa TxRed), Panel C CD-1 mice (2000kDa TxRed), and Panel D CD-1 mice (70kDa TxRed). No significant differences (p>0.05) in vessel density was observed between previously published work and species. Data were analyzed using one-way ANOVA followed by Bonferroni’s multiple comparison test. All values represent mean ± SEM (n=3–6).

