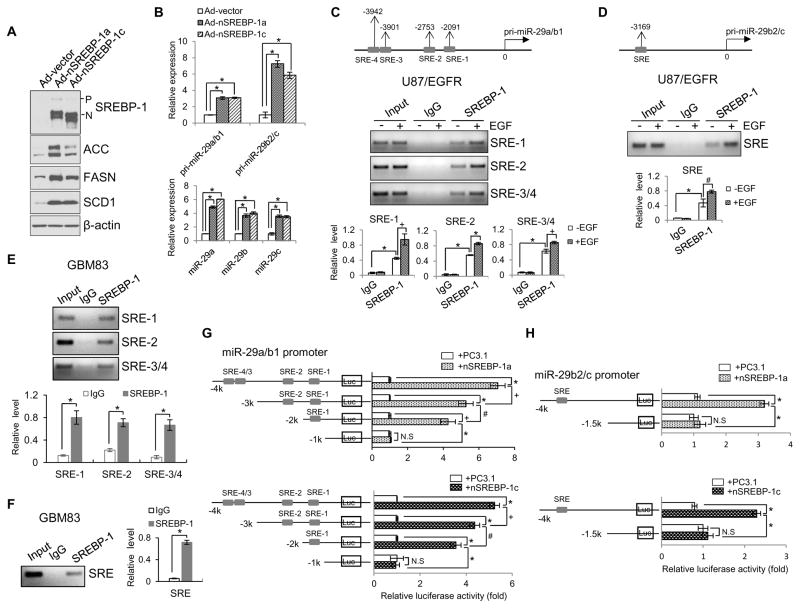
Figure 2. SREBP-1 functions as a transcription factor to promote miR-29 expression.
(A) Western blot analysis of U87 cells after infection with the adenovirus expressing the N-terminal SREBP-1a or -1c (nSREBP-1a or -1c) for 48 hr.
(B) Real-time PCR analysis of the expression of pri-miR29a/b1, pri-miR29b2/c (upper panel) and mature miR-29 (lower panel) in U87 cells after infection with the adenovirus expressing the N-terminal form of SREBP-1a or -1c (nSREBP-1a or -1c) for 48 hr (mean ± SD). Statistical significance was determined by Student’s t-test (n=3); *p<0.001.
(C, D) Schemas at the top show putative SREBP-1 binding sites (SREs) on miR-29a/b1 (C, upper panels) or miR-29b2/c promoter (D, upper panel). Agarose gel electrophoresis of PCR products after chromosomal immunoprecipitation (ChIP) assay using IgG or anti-SREBP-1 antibody in U87/EGFR cells with/without EGF (50 ng/ml) stimulation for 12 hr (C and D, middle panels). The PCR products of the ChIP assay shown on the agarose gel were quantified by ImageJ and normalized with the value of the input without EGF stimulation (C and D, lower panels) (mean ± SD). Statistical significance was determined by Student’s t-test (n=3); #p<0.05, +p<0.01 and *p<0.001.
(E, F) PCR analysis of SREBP-1 binding to the specific SRE motifs located in pri-miR-29a/b1 (E) or pri-miR-29b2/c promoter (F) in primary GBM83 cells. The PCR products of the ChIP assay shown on the agarose gel were quantified by the ImageJ software and normalized with the value of the input (mean ± SD). Statistical significance was determined by an unpaired Student’s t test (n=3). * p<0.01.
(G, H) Luciferase activity analysis of the promoters of miR-29a/b1 (G) or miR-29b2/c (H) with different deletions of SRE binding sites cloned in the pGL3-basic vector that were transfected into HEK293T cells together with Renilla and PC3.1, nSREBP-1a or -1c plasmids for 48 hr (mean ± SD). Statistical significance was determined by Student’s t-test (n=3); +p<0.01, +p<0.01, *p<0.001and N.S, no significance. See also Figures S2.

