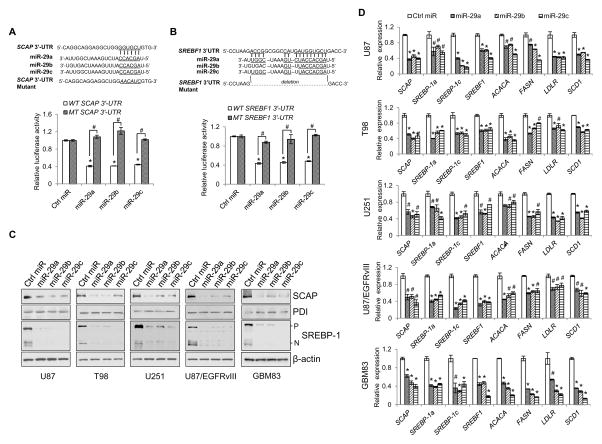
Figure 3. miR-29 reversely inhibits SCAP and SREBP-1 expression through binding to their 3′-UTR.
(A, B) Schemas (upper panels) and luciferase activity analysis of putative miR-29 binding to the 3′-UTR of SCAP (A) or SREBF1 (B) in HEK293T cells transfected with pmirReport vector carrying the wild-type or mutant 3′-UTR together with miR-29 (50 nM) and renilla. The luciferase activity of each sample was normalized with the control transfected with wild-type 3-UTR vector (mean ± SD) (lower panels). Statistical significance was determined by Student’s t-test (n=3); #p<0.01; *p<0.001 compared with scramble control miRNA (Ctrl miR) transfection with wild-type SCAP or SREBF1 3′-UTR. WT, wild-type; MT, mutant.
(C, D) Western blot analysis of the indicated proteins (C) or real-time PCR analysis of gene expression (mean ± SD) (D) for GBM cells transfected with miR-29 (50 nM) for 48 hr. Statistical significance was determined by Student’s t-test (n=3); #p<0.01 or *p<0.001 compared with scramble control miRNA (Ctrl miR) transfection.
See also Figure S3.

