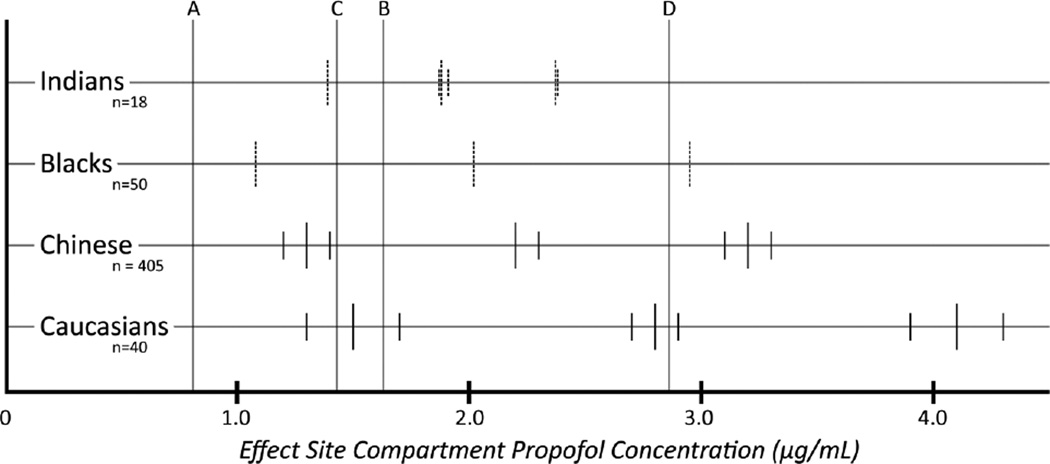
Figure 2.
The effect site compartment EC05, EC50, and EC95 (left to right along each horizontal line corresponding to a race) propofol concentrations at loss of consciousness for four different races. Lines A and B represent the peak ESC concentration (0.81 and 1.63 µg/mL) predicted by the Marsh model (manual mode, non-TCI) for a propofol bolus of 0.5 mg/kg (low end of dosing range for sedation) and 1.0 mg/kg (high end of dosing range for sedation), respectively. Lines C and D represent the peak ESC concentration (1.43 and 2.86 µg/mL) predicted by the Fresenius (modified Marsh model with faster equilibration between the plasma and effect site compartments) model (manual mode, non-TCI) for a propofol bolus of 0.5 mg/kg and 1.0 mg/kg, respectively. Where available or derivable, the 95%CI is also displayed. The short line in the middle of each set is the EC value with the two shorter lines on each side representing the 95%CI. The short vertical lines are shown as dashed lines where the values that they represent are derived instead of being copied verbatim from the prior studies used to create the model.

