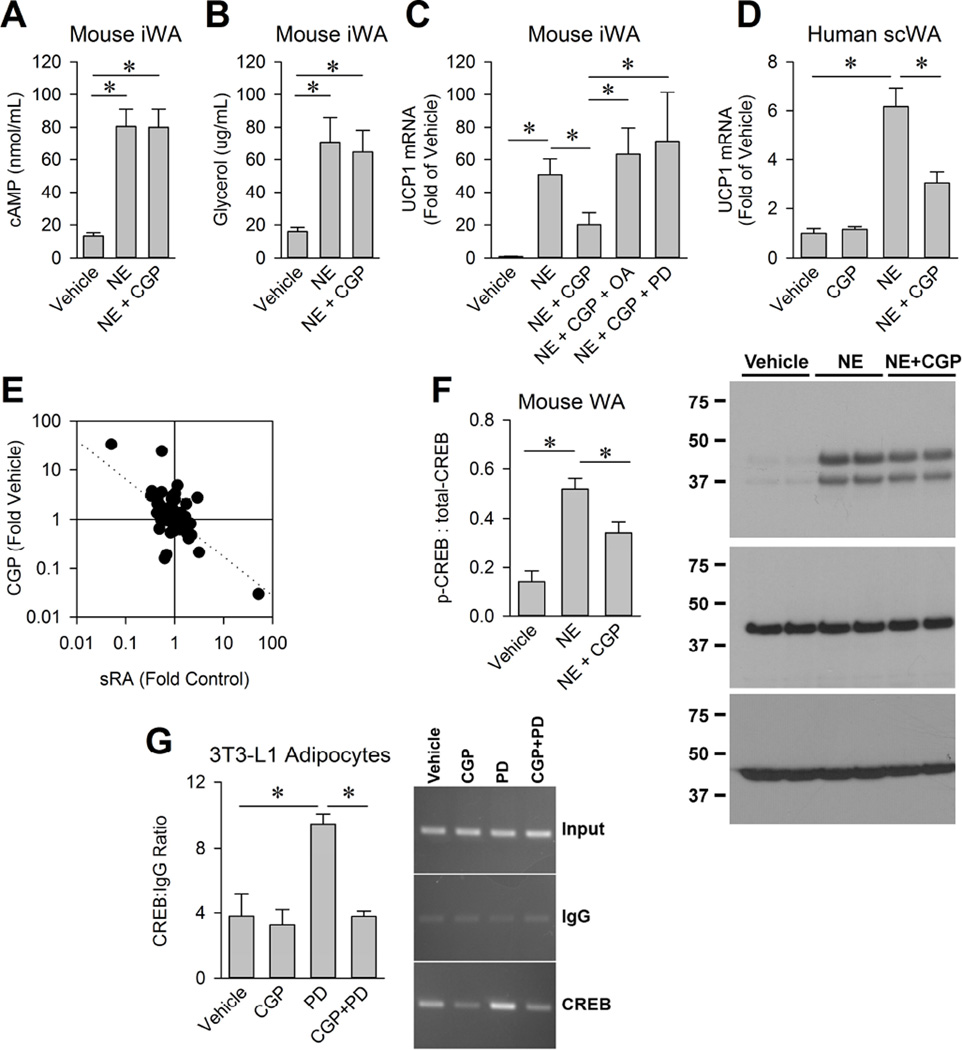
Figure 4. AT2 activation suppresses norepinephrine induced UCP1 in white adipocytes (iWA).
(A) cAMP levels from mouse white adipocytes from iWAT (iWA) following treatment for 6 hours with vehicle, NE (10 µM), or NE and CGP (10 nM) (N=6). (B) Glycerol in the media from mouse iWA following treatment for 6 hours with vehicle, NE, or NE and CGP (N=6). (C) UCP1 mRNA in mouse iWA treatment for 6 hours (N=7–8). (D) UCP1 mRNA in human immortalized adipocytes following treatment for 6 hours with vehicle (N=16), CGP (N=11), NE (N=9), or NE and CGP (N=11). (E) Expression of CREB target genes in iWAT transcriptome dataset. (F) Representative Western blot and quantification of Western blot analysis of total and phosphorylated CREB in mouse iWA treated with vehicle, NE (1 µM), NE + CGP (10 nM; N=5 per group) for 5 min. β-actin served as a loading control. (G) Chromatin immunoprecipitation assay for binding of CREB to the UCP1 promoter with CGP (10 nM) ± PD (10 µM); N=3. * p<0.05 was considered significant. All data presented as mean ± sem. See also Figure S4 and Table S3.

