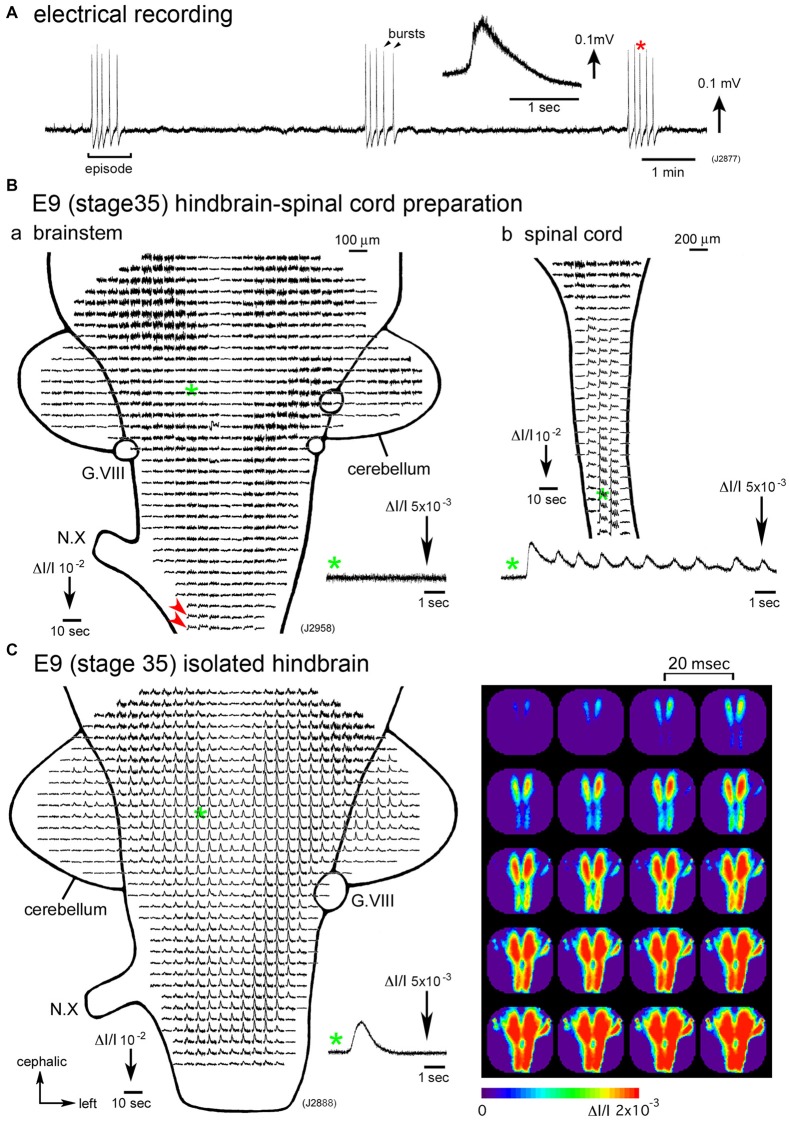
Figure 1.
(A) Electrical recording of spontaneous activity in the chick embryo. The signal was recorded from a hindbrain-spinal cord preparation dissected from an E6 (stage 28) embryo with a glass micro-suction electrode applied to the root of the vagus nerve. In the inset, an enlarged trace of a single burst indicated with a red asterisk is presented. (B) Voltage-sensitive dye recording of the spontaneous activity in an E9 (stage 35) hindbrain-spinal cord preparation. Recordings in (Ba,b) were obtained from the hindbrain and cervical cord of the same preparation, respectively. Enlargements in optical signals indicated with green asterisks are presented in the lower side. Oscillatory activity was detected from the lower medulla (Ba, red arrowheads) and spinal cord (Bb), but not in the pons (Ba, a green asterisk and inset), midbrain, or cerebellum. (C) Voltage-sensitive dye recording of the spontaneous activity that appeared in the isolated hindbrain at E9 (stage 35). A pseudo-color image on the right shows the propagation pattern of the spontaneous activity. The frame interval was 20 ms. Data shown in Figures 1B,C, 2 were obtained using a 1020ch optical recording system (Hirota et al., 1995; Momose-Sato et al., 2001a) with a voltage-sensitive dye, NK2761. The scale on the recordings and images indicates the fractional change in transmitted light intensity, ΔI/I. G.VIII, vestibulo-cochlear ganglion; N.X, vagus nerve (Reproduced from Mochida et al., 2009b; and Momose-Sato and Sato, 2014).

