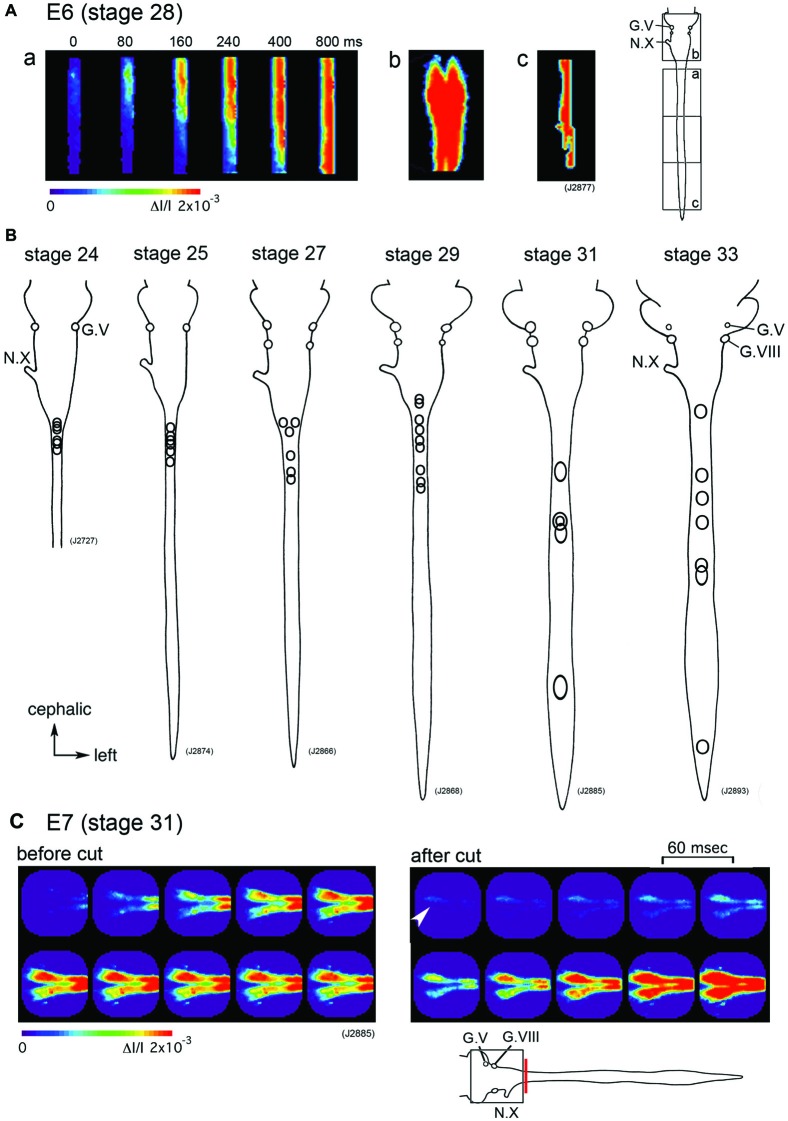
Figure 2.
(A) The propagation pattern of the spontaneous activity in an E6 (stage 28) hindbrain-spinal cord preparation. The activity initiated in the upper cervical cord (a). Images (Ab,c) present maximum responses in the hindbrain and caudal cord, respectively. Images were obtained from the hindbrain and spinal cord indicated with squares in the right inset. (B) The origins of the spontaneous activity are indicated with circles for the most typical preparation at stage 24–33. In each preparation, one circle corresponds to one spontaneous wave, and variations in circle locations show variations in the origin of the activity. (C) Pseudo-color images of the spontaneous activity in an E7 (stage 31) hindbrain-spinal cord preparation before (left images) and after (right images) the obex was cut. Images were obtained from the hindbrain region indicated with a square in the lower inset. The red vertical line shows the location where the cut was made. An arrowhead in the right image indicates the origin of the activity. The frame interval was 60 ms. G.V, trigeminal ganglion; G.VIII, vestibulo-cochlear ganglion; N.X, vagus nerve (Reproduced from Momose-Sato et al., 2009; and Momose-Sato and Sato, 2014).

